Recording Our Findings
Watch this topic in 60 seconds
Free preview · Lesson 1
Understanding Recording Our Findings
Recording Our Findings: A Detective's Guide for Young Scientists!
Hello, young scientists! Have you ever seen something really interesting, like a butterfly landing on a flower, or a colorful rock, and then later wished you could remember every little detail? Or maybe you counted how many red cars you saw on the way to school, but forgot the number by the time you got home?
That's where recording our findings comes in! Think of yourself as a super-smart detective or a cool scientist. When detectives find clues, they don't just hope to remember them. They write them down, draw pictures, or take notes. That's exactly what recording findings is all about!
What Does "Recording Our Findings" Mean?
It simply means writing down, drawing, or showing what you have seen, heard, touched, or counted. It's like making a special notebook for your brain! When you record, you're making a memory helper, so you don't forget important things.
Analogy Time! Imagine you're building a super cool LEGO castle. If you don't write down or draw the steps you took, it might be hard to build it again later, or to show your friend how you did it. Recording is like making a step-by-step guide for your discoveries!
Why Is Recording So Important?
There are many awesome reasons why scientists and detectives (and you!) record their findings:
- To Remember: Our brains are amazing, but they can't remember EVERYTHING. Writing things down is like giving your brain a helpful little assistant!
- To Share: Have you ever found a really neat leaf or seen a funny bird? Recording it means you can easily show and tell your friends, family, or teacher exactly what you saw. It helps you tell your story!
- To See Patterns: If you record how many sunny days there are in a week, and then how many cloudy days, you might start to see a pattern in the weather. Recording helps us compare things!
- To Understand Better: Sometimes, when you draw something or write about it, you notice even more details that you didn't see before. It helps you look closer!
What Can We Record?
You can record all sorts of things!
- Observations: These are things you see, hear, smell, touch, or even taste (if it's safe!). For example, "The plant has three green leaves," or "The bird sang a high-pitched song."
- Measurements: These are numbers! For example, "The worm is 5 centimeters long," or "There are 7 red apples."
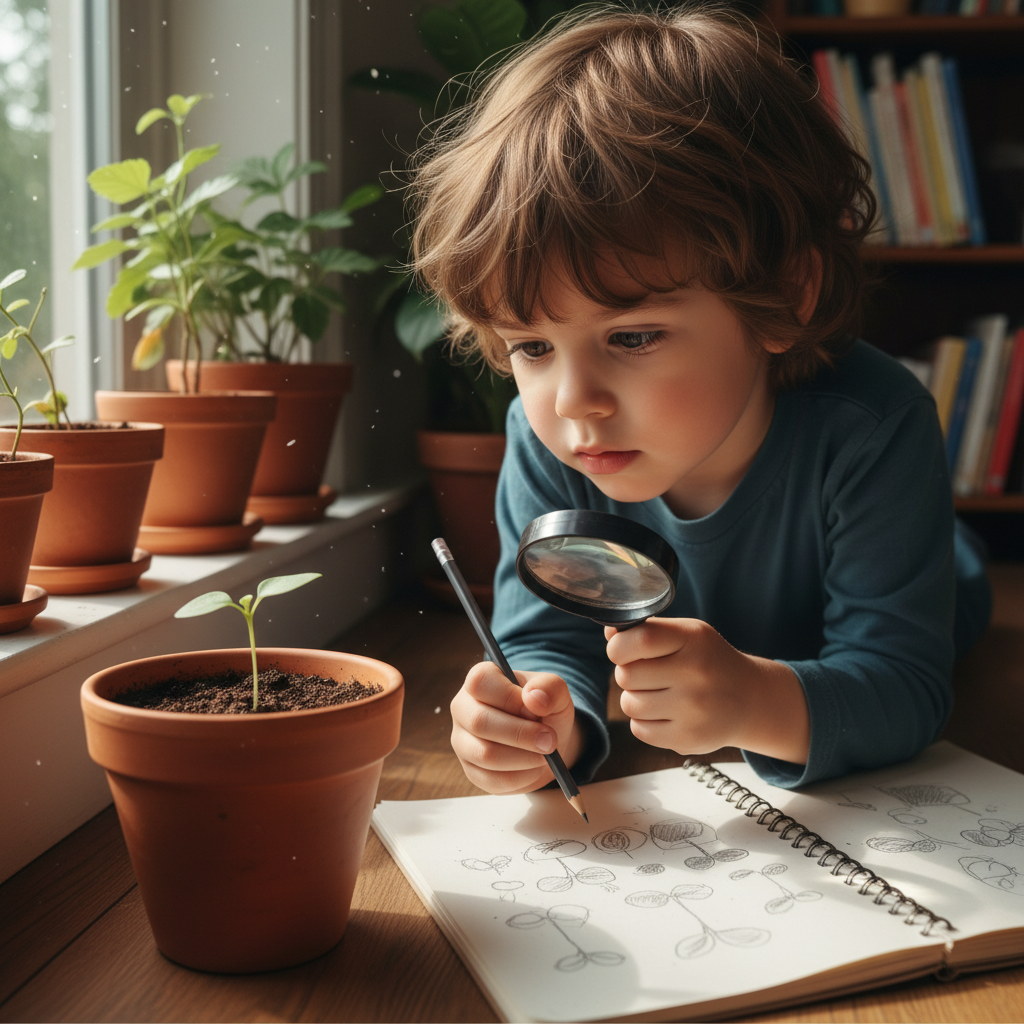
Let's imagine you are a scientist studying how a plant grows. You wouldn't just look at it once and remember everything. You would look at it every day and write down or draw what you see!
How Do We Record Our Findings? (Easy Ways!)
You don't need fancy tools! Here are some simple ways to be a great recorder:
1. Drawing Pictures
This is one of the best ways for young scientists! If you see a beautiful butterfly, drawing it helps you remember its colors and patterns. It's like taking a picture with your pencil! You can draw how many petals a flower has, or what a rock looks like. Your drawing is a piece of your discovery!
Analogy Time! Drawing is like making a visual story. If you can't find the words, your drawing can tell everyone what you saw perfectly!
2. Writing Words and Labels
After you draw something, you can write little words next to it. These are called labels. For example, if you draw a plant, you can label the "leaf," the "stem," and the "flower." You can also write sentences about what you observed, like "The leaf is bright green" or "I saw a ladybug on the leaf."
Analogy Time! Writing words is like giving names to all the things in your picture, so everyone knows exactly what they are!
3. Tally Marks (For Counting!)
Have you ever played a game where you keep score by making little lines? Those are tally marks! They are a super easy way to count things. Every time you count one thing, you make one line ( | ). When you get to five, you make a line across the first four ( |||| ). This helps you count big numbers without getting lost.
Analogy Time! Tally marks are like making tick marks on your fingers, but on paper instead! They help you keep track of how many of something you find.
Example: If you count how many blue cars, red cars, and green cars you see:
- Blue Cars: |||
- Red Cars:
|||| - Green Cars: ||
4. Simple Charts and Tables
A chart or table is like a neat organizer for your information. Imagine you have different kinds of toys, and you put them in different boxes. A chart does the same thing for your findings! You can draw columns and rows to sort what you've found.
Analogy Time! A chart is like having different shelves or baskets in a closet, where each shelf holds a different type of toy. It keeps everything tidy and easy to find!
Example Chart: Favorite Colors in Our Class
| Color | Number of Friends |
|---|---|
| Blue | 7 |
| Red | 5 |
| Green | 3 |
5. Simple Graphs (Pictographs or Bar Graphs)
Graphs are fun ways to show how much of something you found, using pictures or bars.
- Pictograph: You use little pictures to represent what you counted. If one smiley face means one friend, you draw smiley faces to show how many friends like apples!
- Bar Graph: You draw colorful bars that go up. The taller the bar, the more of that thing you counted.
Analogy Time! A graph is like a special picture that tells you "how many" without even needing to read the numbers carefully. It's like seeing who is tallest in a line just by looking!
Let's Practice!
Next time you're outside, or even just looking at your toys, try to record your findings!
- Count how many different types of leaves you see and use tally marks.
- Draw a picture of your favorite animal and label its parts.
- Keep a simple chart of the weather for three days (sunny, cloudy, rainy).
Remember, recording is a powerful tool for any young scientist or detective. It helps you remember, share, and understand the amazing world around you!
Keep learning, free
Create a free Syllabax account to unlock practice questions and games for this topic.
Visual Learning Enhanced! 🚀
To help you master this topic, we use Advanced Syllabax AI to generate detailed diagrams and visual models.
Note on Visuals: The AI sometimes makes spelling errors in image labels. Please refer to the lesson text for the correct terminology.