Mean, median, mode (intro) (Data Handling)
Watch this topic in 60 seconds
Free preview · Lesson 1
Understanding Mean, median, mode (intro) (Data Handling)
Understanding Mean, Median, and Mode: Finding the "Center" of Data!
Imagine you've just collected a bunch of information, like the ages of your friends, the number of goals scored in soccer games, or the heights of your classmates. This bunch of information is called data. But how do we make sense of all these numbers? We need ways to find out what's "typical" or what's in the "middle" of our data. That's where mean, median, and mode come in! They are like different tools we can use to describe the center of our data.
What is Data?
Think of data as a collection of facts or pieces of information, usually in the form of numbers. For example, if we ask 5 friends their favorite ice cream flavors, we might get:
- Chocolate
- Vanilla
- Strawberry
- Chocolate
- Mint Chip
This list is our data! If we were asking for their ages, the data might look like: 11, 12, 10, 11, 13.
Meet the "Center" Stars: Mean, Median, and Mode!
These three terms help us understand a single, representative value for a set of data. Let's explore each one:
1. The Mean: The "Average" Friend
The mean is what most people call the "average." It's like sharing a pile of cookies equally among all your friends. If you have a pile of cookies and you want everyone to have the same amount, you'd:
- Count the total number of cookies.
- Count the total number of friends.
- Divide the total cookies by the number of friends.
To find the mean of a set of numbers, you do almost the same thing:
- Add up all the numbers in your data set. This is like counting all the cookies.
- Count how many numbers are in your data set. This is like counting your friends.
- Divide the sum (total from step 1) by the count (total from step 2).
Example: Let's find the mean of these ages: 10, 11, 12, 11, 13.
- Sum: 10 + 11 + 12 + 11 + 13 = 57
- Count: There are 5 numbers.
- Mean: 57 ÷ 5 = 11.4
So, the mean age is 11.4 years. It's like if you could somehow give each person 11.4 years, it would be the same total age as the group!
2. The Median: The "Middle Child"
The median is the number that sits exactly in the middle of your data when you arrange it in order. Think of a line of people standing by height, from shortest to tallest. The median is the height of the person standing right in the middle of the line.
To find the median:
- Arrange your data in order, from smallest to largest (or largest to smallest – it doesn't matter!).
- Find the middle number.
Important Note:
- If you have an odd number of data points (like 5 friends), there will be one clear middle number.
- If you have an even number of data points (like 6 friends), there will be two numbers in the middle. In this case, you find the median by adding those two middle numbers together and dividing by 2 (finding their mean!).
Example 1 (Odd number of data points): Ages: 10, 11, 12, 11, 13.
- Order the data: 10, 11, 11, 12, 13
- Middle number: The number in the very center is 11.
So, the median age is 11 years.
Example 2 (Even number of data points): Let's add another age: 10, 11, 12, 11, 13, 14.
- Order the data: 10, 11, 11, 12, 13, 14
- Middle numbers: There are two numbers in the middle: 11 and 12.
- Calculate the median: (11 + 12) ÷ 2 = 23 ÷ 2 = 11.5
So, the median age is 11.5 years.
3. The Mode: The "Most Popular" Choice
The mode is the number that appears most often in your data set. Think about a popularity contest – the mode is the item that gets the most votes!
To find the mode:
- Look at all the numbers in your data set.
- Count how many times each number appears.
- The number that appears the most is the mode.
Important Notes:
- A data set can have more than one mode (if two or more numbers appear with the same highest frequency). This is called bimodal (two modes) or multimodal (many modes).
- A data set might have no mode if every number appears only once.
Example 1: Ages: 10, 11, 12, 11, 13.
- 10 appears once.
- 11 appears twice.
- 12 appears once.
- 13 appears once.
The number 11 appears most often. So, the mode is 11.
Example 2: Favorite Colors: Red, Blue, Green, Red, Blue, Yellow, Red, Blue.
- Red appears 3 times.
- Blue appears 3 times.
- Green appears 1 time.
- Yellow appears 1 time.
Both Red and Blue appear 3 times, which is the highest frequency. So, this data set has two modes: Red and Blue. It is bimodal.
Example 3: Numbers: 5, 7, 2, 9, 1.
Each number appears only once. There is no mode for this data set.
Why Use Mean, Median, and Mode?
These measures help us summarize a lot of information into one number. They give us a quick idea of what's typical for the data. For instance, if a teacher wants to know the "average" performance of their class on a test, they might calculate the mean score. If they want to know the "middle" score, they'd find the median. If they want to see which score was most common, they'd find the mode.
Let's look at a quick summary of our data "center" stars!
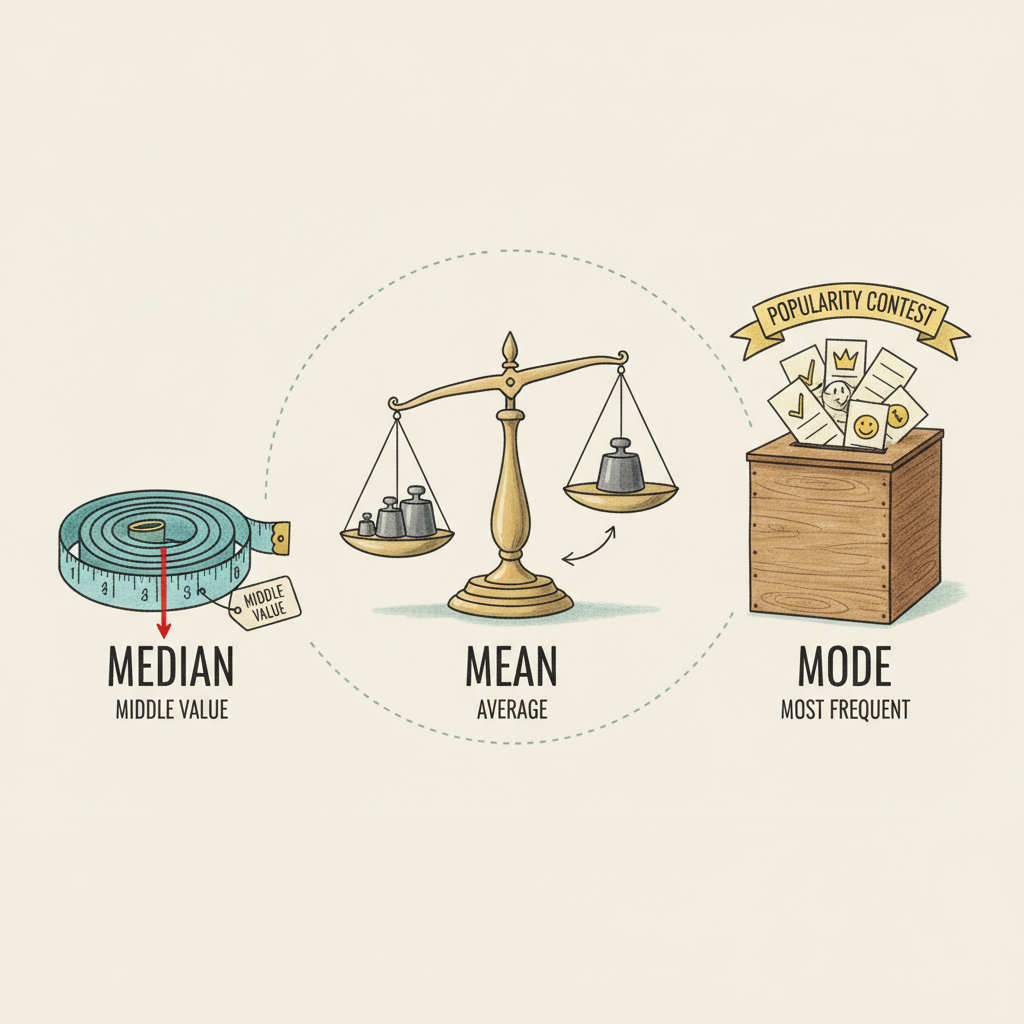
Mean: Like sharing equally. You add all numbers and divide by how many there are.
Median: Like the middle person in a line. You order the numbers and find the one in the middle.
Mode: Like the most popular item. You find the number that shows up most often.
Understanding these three concepts is your first big step in handling data and making sense of numbers around you!
Keep learning, free
Create a free Syllabax account to unlock practice questions and games for this topic.
Visual Learning Enhanced! 🚀
To help you master this topic, we use Advanced Syllabax AI to generate detailed diagrams and visual models.
Note on Visuals: The AI sometimes makes spelling errors in image labels. Please refer to the lesson text for the correct terminology.