Choosing the Best Measure of Center
Watch this topic in 60 seconds
Free preview · Lesson 1
Understanding Choosing the Best Measure of Center
Choosing the Best Measure of Center: Finding the 'Middle Ground' of Your Data! (Grade 7)
Have you ever wondered how to summarize a whole bunch of numbers with just one single number? Imagine you're trying to describe the typical height of all students in your class, or the usual amount of time people spend playing video games. That's where 'measures of center' come in! These special numbers help us find the 'middle' or 'average' value of a dataset.
But here's the trick: just like there are different ways to get to the 'middle' of a park (maybe a straight path, a winding road, or a shortcut), there are different ways to find the 'center' of your data. The most common measures of center are the Mean, the Median, and the Mode. And the big question is: Which one should you choose?
1. The Mean: The "Fair Share" or "Balancing Point"
Think of the Mean as the most traditional 'average'. It's what you usually calculate when you want to find your average test score. It's like everyone in a group pooling all their resources together and then dividing it up equally.
How to Calculate It:
- Add up ALL the numbers in your dataset.
- Divide that total by how many numbers there are.
Example: Let's say your scores on 5 quizzes were: 8, 9, 7, 10, 6.
- Sum: 8 + 9 + 7 + 10 + 6 = 40
- Count: There are 5 scores.
- Mean: 40 / 5 = 8
So, your mean quiz score is 8.
Analogy: The Seesaw. Imagine all your data points are weights on a seesaw. The mean is the exact spot where you'd place the fulcrum (the pivot point) to make the seesaw perfectly balanced. Every number pulls its weight!
When to Use the Mean:
- When your data doesn't have extreme values (numbers that are much, much bigger or much, much smaller than the rest). We call these extreme values 'outliers'.
- When your data is pretty symmetrical, meaning it looks somewhat like a bell curve if you were to graph it (the left side mirrors the right side).
- When you want a measure that uses all the data values in its calculation.
2. The Median: The "Middle Child" or "True Middle"
The Median is literally the middle number when your data is arranged in order from smallest to largest. It doesn't care about how big or small the extreme values are, only about its position.
How to Find It:
- Arrange ALL the numbers in your dataset from least to greatest (or greatest to least, it doesn't matter!).
- Find the middle number. If you have an odd number of data points, it's the one right in the center.
- If you have an even number of data points, there will be two middle numbers. In this case, you take those two numbers, add them together, and divide by 2 (find their mean!).
Example 1 (Odd number of data points): Your quiz scores: 8, 9, 7, 10, 6.
- Ordered: 6, 7, 8, 9, 10
- The middle number is 8. So, the median is 8.
Example 2 (Even number of data points): Let's add another score, say 12: 8, 9, 7, 10, 6, 12.
- Ordered: 6, 7, 8, 9, 10, 12
- There are two middle numbers: 8 and 9.
- Median: (8 + 9) / 2 = 17 / 2 = 8.5
Analogy: The Line-Up. Imagine all students in your class line up from shortest to tallest. The median height would be the height of the person standing exactly in the middle of that line. It doesn't matter if there's a basketball player who's super tall or a tiny toddler, the median person's height just represents the middle position.
When to Use the Median:
- This is SUPER important: When your data has outliers (extreme values). The median is less affected by outliers than the mean.
- When your data is skewed (meaning most of the data is bunched up on one side, and there's a long 'tail' of values on the other side).
- When you are interested in the 'typical' value in a situation where extreme values might distort the average (e.g., house prices in a neighborhood).
3. The Mode: The "Most Popular" or "Frequent Winner"
The Mode is the easiest to understand: it's simply the number that appears MOST often in your dataset. It's like finding the most popular flavor of ice cream!
How to Find It:
- Look at all your numbers.
- Count how many times each number appears.
- The number that shows up the most is the Mode.
Example: Test scores: 7, 8, 8, 9, 10, 7, 8.
- 7 appears 2 times.
- 8 appears 3 times.
- 9 appears 1 time.
- 10 appears 1 time.
The number 8 appears most often, so the Mode is 8.
Special Cases for Mode:
- You can have more than one mode (e.g., if both 7 and 8 appeared 3 times, then both 7 and 8 would be modes – this is called bimodal).
- You can have NO mode if all numbers appear only once.
Analogy: Favorite Color Poll. If you ask everyone in your class their favorite color, the color chosen by the most students would be the mode. It tells you what's most common, not necessarily what's in the middle or the average.
When to Use the Mode:
- When you are dealing with categorical data (data that falls into categories, like favorite colors, types of pets, shoe sizes). You can't calculate a mean or median for colors!
- When you want to know the most frequent or common item/value in a set.
- Sometimes useful for numerical data if you want to identify peaks in the data distribution.
The TRICKY Part: Outliers!
An outlier is a data point that is much, much larger or much, much smaller than the other values in a dataset. It's like having a 7-foot tall person join a group of kindergartners – they really stand out!
Let's see how outliers affect the mean and median:
Imagine the salaries of 5 employees at a small company (in thousands of dollars): 30, 35, 40, 45, 50.
- Mean: (30+35+40+45+50) / 5 = 200 / 5 = 40 thousand dollars.
- Median: (Ordered: 30, 35, 40, 45, 50) = 40 thousand dollars.
Now, imagine the CEO joins the company and earns 500 thousand dollars a year. Our new salaries: 30, 35, 40, 45, 50, 500.
- New Mean: (30+35+40+45+50+500) / 6 = 700 / 6 = 116.67 thousand dollars (approximately).
- New Median: (Ordered: 30, 35, 40, 45, 50, 500). The two middle numbers are 40 and 45. (40+45)/2 = 85/2 = 42.5 thousand dollars.
Notice how the mean jumped from 40 to 116.67! The CEO's super-high salary pulled the average way up, making it seem like the 'typical' employee earns much more than they actually do. But the median only moved from 40 to 42.5. It was barely affected because it only cares about the middle position, not the actual value of the outlier.
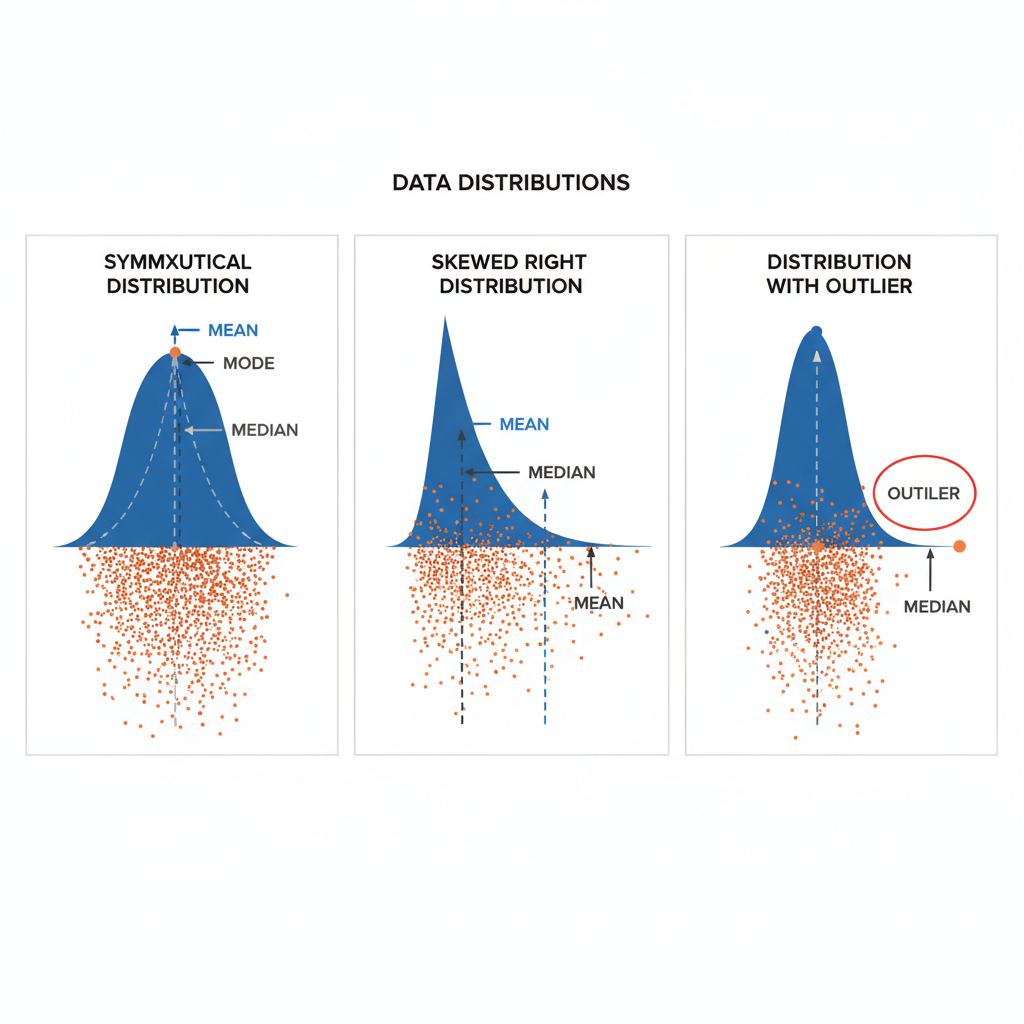 ⚠️ This picture may have spelling mistakes. Trust the words in the lesson.
Summary: When to Choose Which!
| Measure of Center | Definition | When to Use It (Key Points) |
|---|---|---|
| Mean | The average (sum of all values divided by the count). |
|
| Median | The middle value when data is ordered. |
|
| Mode | The value that appears most frequently. |
|
Putting It All Together!
Choosing the best measure of center is all about understanding your data and what story you want to tell. Think of yourself as a detective, and your data as clues. Each measure of center gives you a different piece of the puzzle.
- If the data is neatly packed and balanced, the mean is often the best summary.
- If there are some wild, extreme numbers throwing things off, the median is your reliable choice.
- If you're just looking for the crowd favorite or the most common category, the mode is your answer.
By asking yourself, "Does my data have outliers?" or "Is my data mostly categories?" you can make a smart choice and accurately describe the 'middle ground' of your numbers!
Keep learning, free
Create a free Syllabax account to unlock practice questions and games for this topic.
Visual Learning Enhanced! 🚀
To help you master this topic, we use Advanced Syllabax AI to generate detailed diagrams and visual models.
Note on Visuals: The AI sometimes makes spelling errors in image labels. Please refer to the lesson text for the correct terminology.