Learning Journey
Free preview · Lesson 1
Understanding What is a Picture Graph?
Welcome to the World of Picture Graphs!
Hello, young explorers! Today, we're going on an exciting adventure to learn about something really cool called a Picture Graph. It might sound like a big word, but it's actually super simple and super fun! Think of it like a special way to show information using drawings, just like telling a story with pictures instead of lots of words.
What is a Graph, Anyway?
Before we jump into picture graphs, let's talk about what a 'graph' is. Imagine you have a big pile of your favorite toys – maybe some cars, some teddy bears, and some building blocks. If you want to know which toy you have the most of, you could just count them. But what if you wanted to quickly show someone else how many of each toy you have, without them having to count themselves? That's where a graph comes in!
A graph is like a neat and tidy way to organize information so you can see it very clearly and quickly. It helps us compare things and answer questions like 'Which one has more?' or 'Which one has less?' It's like putting all your toys in special labeled boxes so you can instantly see which box is fuller!
Introducing the Picture Graph!
Now, let's talk about our special kind of graph: the Picture Graph. Can you guess what makes it special? That's right, it uses pictures! Instead of just numbers, a picture graph uses little drawings or symbols to show how many of something there are. It's like drawing a picture of an apple every time you count an apple, instead of just writing the number '1'.
Imagine you counted all the different fruits in a basket: 3 apples, 2 bananas, and 4 oranges. A picture graph would show 3 little apple pictures, 2 little banana pictures, and 4 little orange pictures. Isn't that a fun way to show numbers?
The Main Parts of a Picture Graph
Every good picture graph has a few important parts. Think of them like the parts of a puzzle; you need all the pieces to see the whole picture!
- The Title: What is it all about?
Every picture graph needs a title. The title is like the name of the graph. It tells us right away what information the graph is showing. For example, if you're counting favorite colors, the title might be 'Our Class's Favorite Colors'. It's the first thing you look at to understand what story the graph is trying to tell you. - Categories: What are we counting?
Picture graphs usually compare different types of things. These are called categories. In our fruit example, 'apples', 'bananas', and 'oranges' would be our categories. Each category will have its own row or column of pictures. They tell you *what* things you are comparing. - Pictures/Symbols: The stars of the show!
These are the little drawings that make a picture graph so unique and easy to understand. Each picture or symbol stands for one or more items. If you're counting teddy bears, you might draw a little teddy bear picture for each bear you count. - The Key (or Legend): This is SUPER Important!
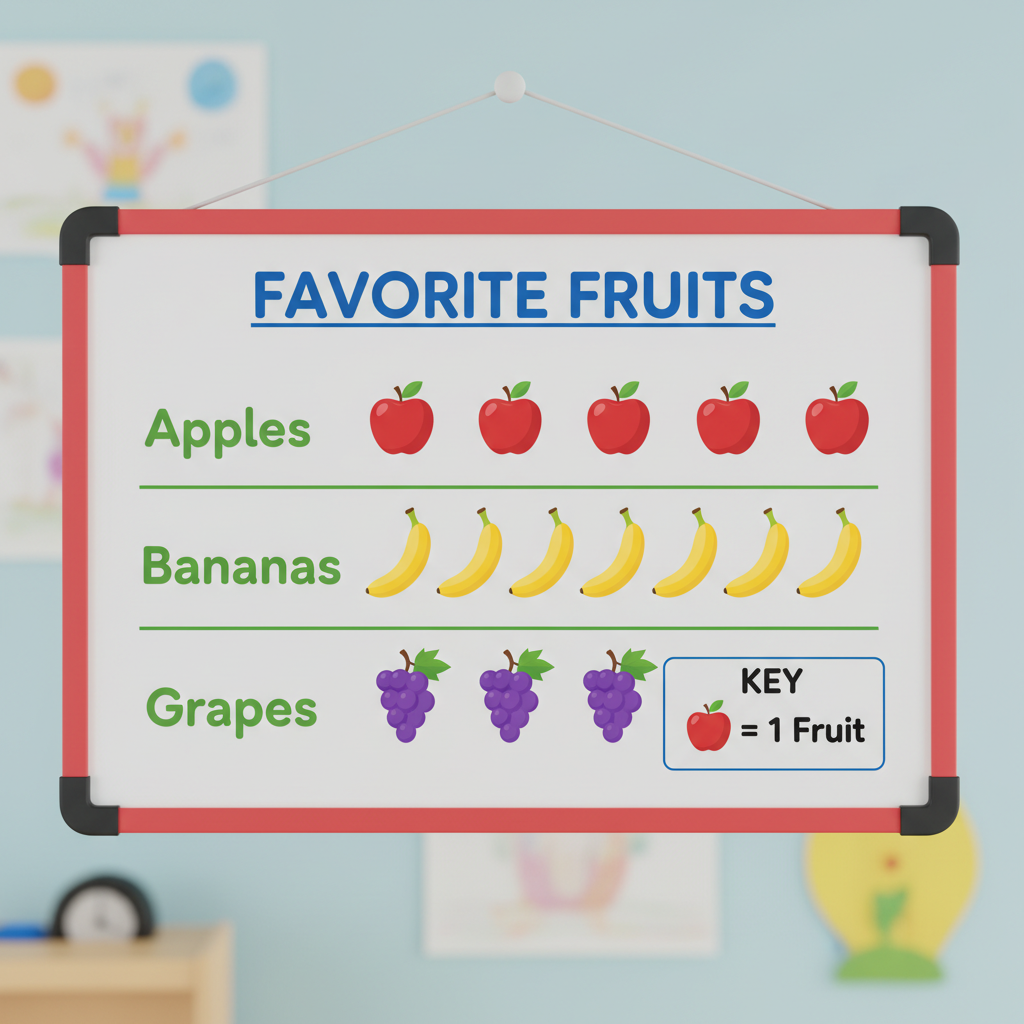
The key is perhaps the most important part of a picture graph. It's like a secret code breaker! The key tells you exactly what each picture stands for. Sometimes, one picture means just one thing. But other times, one picture might stand for TWO things, or even FIVE things! For example, a key might say: '🍎 = 1 apple'. This tells you that every apple picture you see on the graph means one real apple. If the key said '🍎 = 2 apples', then every apple picture would mean two real apples! You ALWAYS need to look at the key first, otherwise, you might count incorrectly!
Here's what a simple picture graph might look like:
How to Read a Picture Graph
Reading a picture graph is like reading a map to find treasure! Just follow these easy steps:
- Step 1: Read the Title! First, look at the very top. What is the graph about? This gives you the main idea.
- Step 2: Look at the Categories! See what different things are being counted or compared. Are they colors? Animals? Toys?
- Step 3: Find the Key! This is a super important step! Look for the 'key' (sometimes called a 'legend'). It will tell you what each picture means. For Grade 1, usually, one picture means one thing. So, if you see a picture of a star, the key might say 'One star = 1 person'.
- Step 4: Count the Pictures! Now that you know what each picture means (from the key!), you can count how many items are in each category. If the key says 'one picture = one item', then you just count all the pictures for each category. If the key says 'one picture = two items', then for every picture you see, you count 'two' instead of 'one'.
- Step 5: Compare and Answer! Once you've counted, you can easily compare! You can see which category has the most pictures, which has the fewest, or if any have the same amount. This helps you answer questions quickly!
Why are Picture Graphs so Great?
Picture graphs are awesome because they make numbers and information easy to see and understand, even for grownups! Instead of looking at a list of numbers, you can see pictures, which makes counting and comparing much more fun and quicker for your brain. They help us:
- See things quickly: You can tell at a glance which group has more or less.
- Organize information: It puts everything in a neat order.
- Understand numbers better: The pictures help make the numbers feel real.
Imagine your teacher wants to know everyone's favorite animal. If she just asked everyone and wrote down 'dog, cat, dog, bird, cat, dog...', it would be hard to know which animal was most popular. But if she made a picture graph, you could quickly see a long row of dog pictures, a shorter row of cat pictures, and just one bird picture. Immediately, you'd know dogs are the favorite!
Learning about picture graphs is a fantastic skill because you'll see graphs everywhere – in books, on TV, and even when you're older, they help people understand important information very fast. It's like learning a special visual language for numbers!
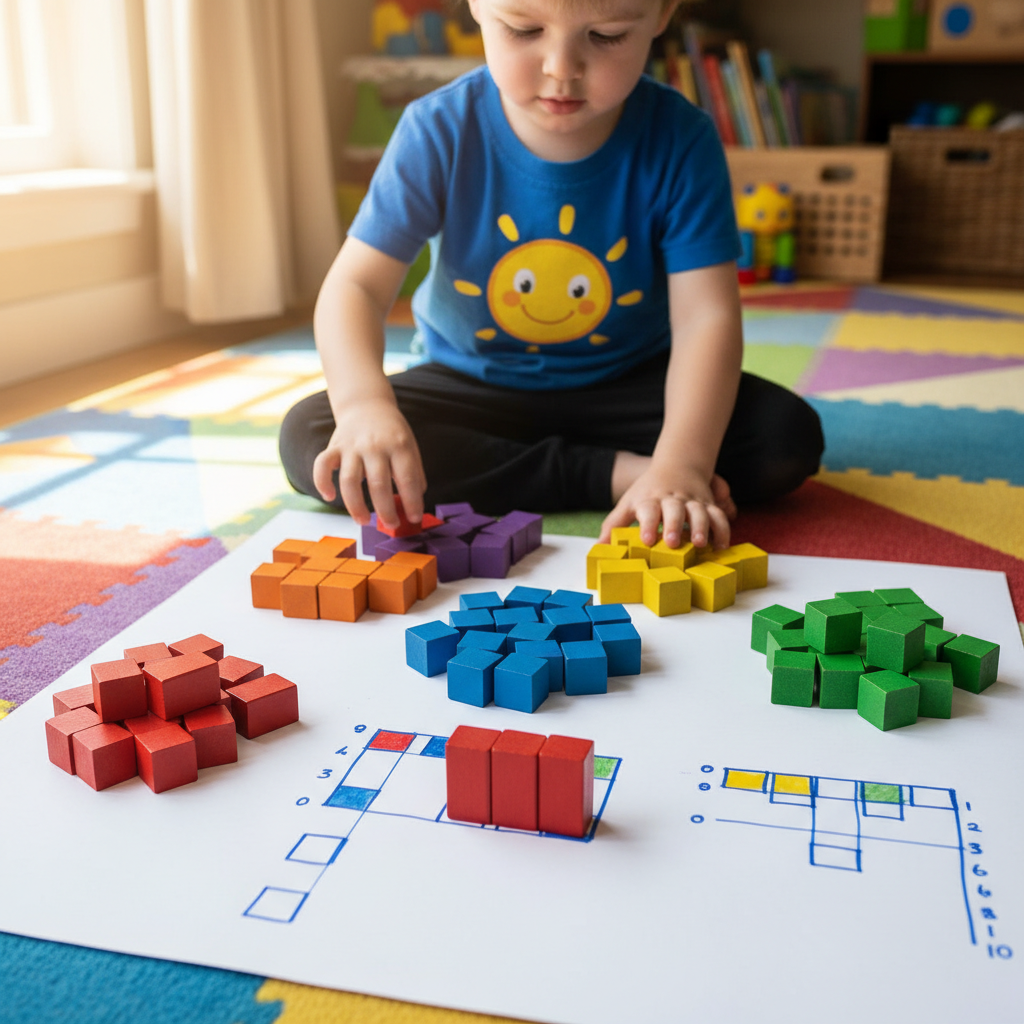 ⚠️ This picture may have spelling mistakes. Trust the words in the lesson.
So, next time you see a chart with pictures, you'll know exactly what it is – a picture graph! And you'll know how to read its secret message, all thanks to the title, categories, pictures, and especially that important key!
Keep learning, free
Create a free Syllabax account to unlock practice questions and games for this topic.
Visual Learning Enhanced! 🚀
To help you master this topic, we use Advanced Syllabax AI to generate detailed diagrams and visual models.
Note on Visuals: The AI sometimes makes spelling errors in image labels. Please refer to the lesson text for the correct terminology.