Types of Data: Qualitative & Quantitative
Watch this topic in 60 seconds
Free preview · Lesson 1
Understanding Types of Data: Qualitative & Quantitative
Understanding Data: Qualitative vs. Quantitative (Grade 9)
Welcome, future data detectives! In our daily lives, we're constantly surrounded by information – everything from the weather forecast to your friend's favorite color is a piece of data. But did you know that not all data is created equal? Just like you wouldn't use a hammer to cut a piece of paper, you wouldn't use the same tools to understand every type of information. That's why it's super important to learn about the two main types of data: Qualitative Data and Quantitative Data.
What is Data, Anyway?
Think of data as raw facts and figures that we collect. It's like the individual ingredients you gather before baking a cake – flour, sugar, eggs, milk. Each ingredient is a piece of data. Once you have all the ingredients, you can start to understand what kind of cake you're going to make! In the world of science, business, and even everyday problem-solving, collecting and understanding data is the first step to making sense of the world around us.
1. Qualitative Data: The World of Descriptions and Qualities
Imagine you're describing your favorite movie to a friend. You might talk about the exciting plot, the vibrant colors, the thrilling music, or how the characters made you feel. You're not using numbers; you're using words to describe qualities and characteristics. This is exactly what qualitative data is all about!
What is it?
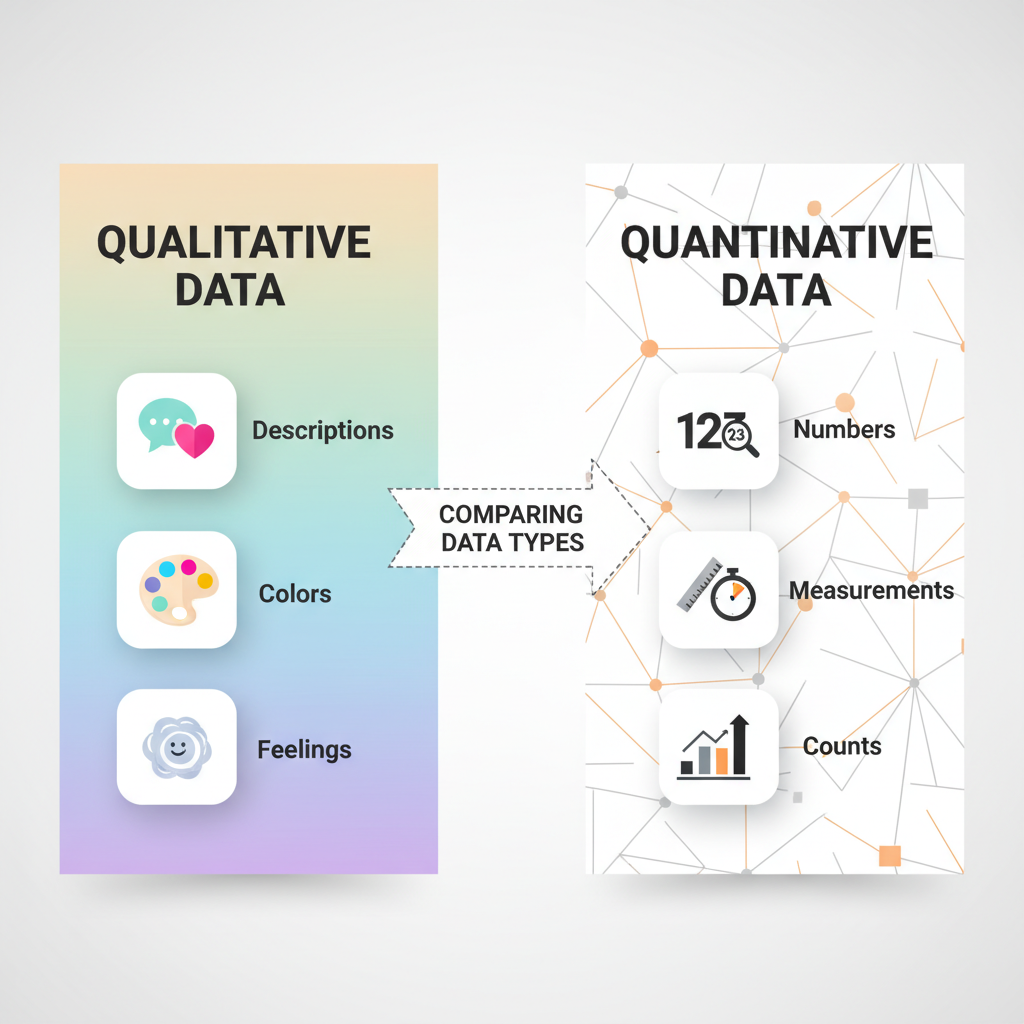
Qualitative data describes qualities or characteristics. It's descriptive and non-numeric. Think 'quality' when you hear 'qualitative'. It's about 'what kind' or 'how' something is, rather than 'how many' or 'how much'. This type of data helps us understand the 'why' behind phenomena and often involves observations, opinions, and descriptions.
Analogies to Help You Understand:
- Movie Critic: A movie critic writes reviews talking about the acting, the storyline, the mood, and the visual style. They don't usually give a numerical score to these individual elements; they describe them with words.
- Art Class: When you describe a painting, you might talk about the 'bright red' of the apple, the 'somber mood' of the landscape, or the 'smooth texture' of the canvas. These are all qualitative descriptions.
- Ice Cream Flavors: You can describe ice cream as 'creamy', 'sweet', 'tart', 'rich chocolate', or 'refreshing mint'. These are qualities, not numbers.
Key Features of Qualitative Data:
- Descriptive: It tells a story or provides details.
- Non-numeric: It cannot be counted or measured numerically.
- Categorical: It often puts things into categories or labels (e.g., 'tall', 'medium', 'short' for height descriptions, or 'red', 'blue', 'green' for colors).
- Collected via: Observations, interviews (asking open-ended questions like 'How do you feel about...?'), focus groups, surveys with open text fields.
Examples of Qualitative Data:
- The color of someone's eyes (blue, brown, green).
- Your favorite subject in school (Math, English, Science).
- Descriptions of a student's behavior (attentive, disruptive, quiet).
- The type of car someone drives (sedan, SUV, truck).
- Opinions on a new school policy (positive, negative, neutral).
2. Quantitative Data: The World of Numbers and Measurements
Now, let's switch gears. Imagine you're keeping score in a basketball game. You're counting points, keeping track of how many shots were made, and measuring how tall the players are. You're using numbers, right? This is exactly what quantitative data is!
What is it?
Quantitative data deals with numbers and things you can measure or count. Think 'quantity' when you hear 'quantitative'. It's about 'how much' or 'how many'. This type of data is objective, measurable, and often expressed in numerical form.
Analogies to Help You Understand:
- Shopping Trip: When you go grocery shopping, you buy a 'dozen' eggs, '3' pounds of apples, or a '2-liter' bottle of soda. These are all numbers representing quantities.
- Measuring Height: If you measure your height, you might say you are '160 cm' tall. That's a specific number.
- Bank Account: The amount of money you have in your bank account is a number.
 ⚠️ This picture may have spelling mistakes. Trust the words in the lesson.
Key Features of Quantitative Data:
- Numeric: Always expressed in numbers.
- Measurable/Countable: You can perform mathematical operations (like adding, subtracting, averaging) on it.
- Objective: Less open to interpretation than qualitative data.
- Collected via: Surveys with closed-ended questions (like 'How many hours do you study?'), experiments, sensors, direct measurements.
Examples of Quantitative Data:
- The number of students in your class (e.g., 30 students).
- Your height in centimeters (e.g., 175 cm).
- The temperature outside (e.g., 25 degrees Celsius).
- The number of books you read last year (e.g., 12 books).
- Your score on a math test (e.g., 92%).
A Little Deeper: Two Types of Quantitative Data
Quantitative data can actually be broken down into two sub-types:
a) Discrete Quantitative Data:
This is data that can only take specific, distinct values, and you can usually count them. There are no 'in-between' values. Think of things you count in whole numbers.
- Analogy: Counting the number of cookies on a plate. You can have 1 cookie, 2 cookies, or 3 cookies, but you can't have 2.5 cookies (unless you break one, but then it's not a whole cookie anymore!).
- Examples: Number of siblings, number of cars in a parking lot, number of correct answers on a quiz.
b) Continuous Quantitative Data:
This is data that can take any value within a certain range. It's usually measured, and the precision depends on the measuring tool. Think of measurements that can be infinitely more precise.
- Analogy: Measuring your height. You might say 160 cm, but if you had a super precise ruler, you could say 160.2 cm, or 160.25 cm, or even 160.254 cm! There's an infinite number of possible values between 160 and 161 cm.
- Examples: Height, weight, temperature, time, speed.
Why Does This Matter?
Understanding the difference between qualitative and quantitative data is like knowing the difference between a screwdriver and a wrench. Both are tools, but you use them for different tasks. If you're trying to understand how people feel about a new product, you'd collect qualitative data (interviews, open-ended feedback). If you want to know how many people bought the new product, you'd collect quantitative data (sales figures).
Choosing the right type of data helps you gather the right information, analyze it correctly, and ultimately make better decisions or draw more accurate conclusions. So, next time you encounter information, take a moment to ask yourself: Is this a description (qualitative) or a number (quantitative)?
Let's Summarize!
- Qualitative Data: Describes qualities, characteristics, and non-numeric attributes. It's about 'what kind' or 'how'.
- Quantitative Data: Deals with numbers and things you can measure or count. It's about 'how much' or 'how many'.
- Discrete Quantitative Data: Countable, specific whole number values (e.g., number of students).
- Continuous Quantitative Data: Measurable, can take any value within a range (e.g., height, temperature).
Great job! You've taken your first big step into the fascinating world of data analysis. Keep practicing your data detective skills!
Keep learning, free
Create a free Syllabax account to unlock practice questions and games for this topic.
Visual Learning Enhanced! 🚀
To help you master this topic, we use Advanced Syllabax AI to generate detailed diagrams and visual models.
Note on Visuals: The AI sometimes makes spelling errors in image labels. Please refer to the lesson text for the correct terminology.