Pictographs [Data Basics]
Watch this topic in 60 seconds
Free preview · Lesson 1
Understanding Pictographs [Data Basics]
Learning Resource: Pictographs - Understanding Data Basics
Welcome, young data detectives! Today, we're going on an exciting adventure into the world of 'Pictographs'. Don't let the big word scare you; it just means we're going to learn how to use pictures to understand information, like a secret code! Think of it as a fun way to organize and see numbers using cute drawings.
What is Data?
Before we dive into pictographs, let's talk about 'data'. Data is just a fancy word for information. It could be anything!
- The number of pets your friends have.
- The types of fruits in a fruit basket.
- The colors of cars in a parking lot.
- How many hours you sleep each night.
What is a Pictograph?
A 'pictograph' is a way to show data using pictures or symbols. Each picture represents a certain number of things. It's like having a tiny drawing stand for a big group of items.
Why Use Pictographs?
Pictographs are super helpful for a few reasons:
- They make data easy to see: Instead of looking at a long list of numbers, you can quickly see which category has the most or least.
- They are fun and colorful: Who doesn't love pictures? They make learning about data more engaging.
- They help us compare: It's easy to compare different groups when they are represented by pictures.
Key Parts of a Pictograph
Every good pictograph has a few important parts:
- Title: This tells you what the pictograph is all about. Like the name of a book!
- Labels: These tell you what each category or row/column is representing. For example, 'Favorite Colors' or 'Number of Students'.
- Pictures/Symbols: These are the drawings that represent your data.
- Key: This is the MOST important part! The key tells you how many each picture stands for. It's like the secret decoder ring for your pictograph.
Let's Look at an Example!
Imagine our class wants to know everyone's favorite fruit. We collect the data:
- Apples: 10 students
- Bananas: 15 students
- Oranges: 5 students
- Grapes: 12 students
Now, let's make a pictograph. We need to decide on a picture and a key.
Title: Favorite Fruits in Our Class
Key: Each 🍎 represents 2 students.
Here's how our pictograph might look:
| Fruit | Number of Students |
|---|---|
| Apples | 🍎 🍎 🍎 🍎 🍎 |
| Bananas | 🍎 🍎 🍎 🍎 🍎 🍎 🍎 🍏 (half apple for 1 student, or use a different symbol) |
| Oranges | 🍎 🍎 🍏 (half apple) |
| Grapes | 🍎 🍎 🍎 🍎 🍎 🍏 (half apple) |
Wait a minute! Using whole apples for 2 students and half apples for 1 student can get a bit tricky, especially with numbers that aren't even. Sometimes, it's better if each picture represents a bigger number, like 5 or 10. Let's try again with a different key!
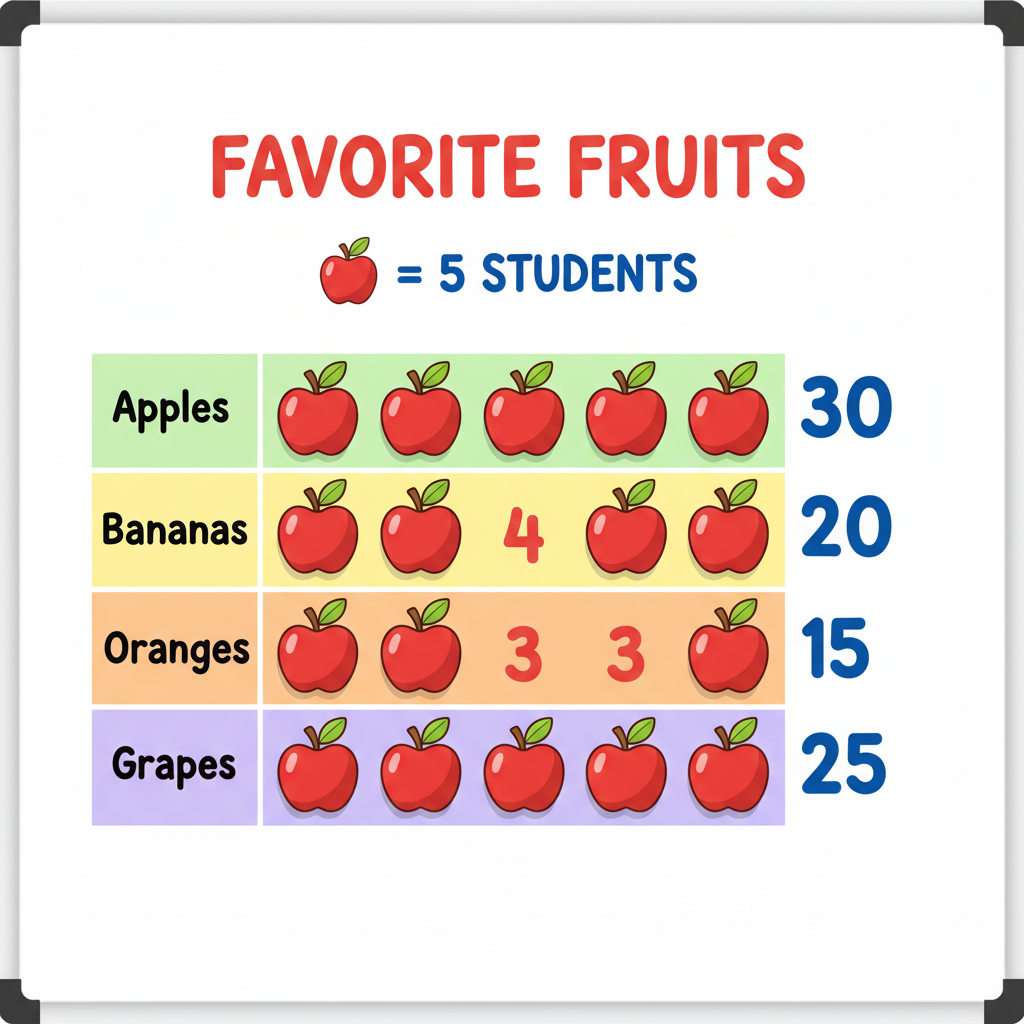
Revised Key: Each 🍎 represents 5 students.
(2 x 5 = 10 students) (3 x 5 = 15 students) (1 x 5 = 5 students) (This still requires careful explanation - ideally we'd use full symbols if possible. Let's assume for simplicity each full symbol is 5, and we can have partial symbols if needed, or better yet, a different symbol for smaller counts. For this example, let's stick to the idea that the numbers work out nicely or we deal with fractions of symbols, but it highlights why choosing the right key is important!) For Grapes (12 students), with each 🍎 = 5: we'd have 🍎 🍎 (10 students) and then a way to show 2 students. This might be a partial apple, or a smaller symbol, or we might need a different strategy if our data has lots of tricky numbers. For now, let's imagine we adjust the data slightly for simplicity or use fractions: 🍎 🍎 (10) + a small mark representing 2 students. A better approach for 12 would be if each 🍎 was 2 students, then we'd use 6 apples. But the key is what matters!See? The second key with each apple representing 5 students makes it much cleaner for apples, bananas, and oranges. Grapes (12 students) would need 2 full apples (10 students) and then some way to show the remaining 2 students. This often involves using a partial symbol, which is important to understand from the key!
Let's clarify the Grapes for the 'each 🍎 represents 5 students' key. With 12 students:
- We have two full apples: 🍎 🍎 (which equals 5 + 5 = 10 students).
- We need to show 2 more students. Since a whole apple is 5, we can't use another whole apple.
- We might use a part of an apple. If the key said 'a full apple is 5 students, and a half apple is 2.5 students', it gets complicated.
- A better way is to define the key clearly: Key: Each 🍎 = 5 students. A small fraction of an apple can represent a proportional number of students (e.g., one-fifth of an apple for 1 student). Or, for simplicity in foundational learning, we might choose keys where our data fits neatly.
For our 6th-grade foundational level, let's stick to the idea that the key makes it easy. If our data was Apples: 10, Bananas: 15, Oranges: 5, Grapes: 20, then with Key: Each 🍎 = 5 students:
- Apples: 🍎 🍎 (10)
- Bananas: 🍎 🍎 🍎 (15)
- Oranges: 🍎 (5)
- Grapes: 🍎 🍎 🍎 🍎 (20)
This is much clearer! The choice of key is crucial for making a good pictograph.
Reading a Pictograph
Reading a pictograph is like being a detective. You use the clues (pictures and the key) to figure out the information.
Example:
Let's say we have a pictograph showing the number of books read by students in a week.
Title: Books Read Last Week
Key: Each 📚 = 3 books
- Student A: 📚 📚 📚
- Student B: 📚 📚
- Student C: 📚 📚 📚 📚
To find out how many books Student A read, we look at their row and see three 📚 symbols. We then check the key: each 📚 is 3 books. So, Student A read 3 * 3 = 9 books.
Student B read 2 * 3 = 6 books.
Student C read 4 * 3 = 12 books.
Creating Your Own Pictograph
Follow these simple steps:
- Collect Your Data: Decide what information you want to show and gather the numbers.
- Choose a Title: Give your pictograph a clear title.
- Choose Symbols: Pick simple pictures or symbols that represent your data.
- Decide on a Key: This is SUPER important! Decide how many items each symbol will stand for. Make sure your key makes the pictograph easy to read. If you have small numbers, maybe each symbol is 1 or 2. If you have large numbers, maybe each symbol is 10, 50, or 100.
- Draw Your Pictograph: Create rows or columns for each category and draw the correct number of symbols.
Common Mistakes to Avoid
Be careful not to...
- Forget the title or key.
- Use too many symbols for each item (makes the graph too long).
- Use too few symbols for each item (if numbers are small, each symbol might just be 1).
- Draw symbols that are hard to count or are inconsistent.
- Misinterpret the key! Always double-check what each symbol means.
Pictographs in Real Life
You might see pictographs used in:
- Newspapers to show weather or sports scores.
- Children's books to illustrate simple facts.
- Infographics online to present information quickly.
They are a fun and accessible way to communicate information!
| Fruit | Number of Students |
|---|---|
| Apples | 🍎 🍎 |
| Bananas | 🍎 🍎 🍎 |
| Oranges | 🍎 |
| Grapes | 🍎 🍎 🍏 (part of an apple or another symbol) |
Keep learning, free
Create a free Syllabax account to unlock practice questions and games for this topic.
Visual Learning Enhanced! 🚀
To help you master this topic, we use Advanced Syllabax AI to generate detailed diagrams and visual models.
Note on Visuals: The AI sometimes makes spelling errors in image labels. Please refer to the lesson text for the correct terminology.