Collecting Classroom Data
Watch this topic in 60 seconds
Free preview · Lesson 1
Understanding Collecting Classroom Data
Collecting Classroom Data: Becoming a Classroom Detective!
Have you ever played a game where you needed to keep score? Or maybe helped bake a cake and had to measure ingredients? What about deciding which movie to watch with friends by asking everyone for their favorite genre? In all these situations, you were actually collecting and using data! Data might sound like a fancy, grown-up word, but it's something we use all the time, even in our classroom.
What is Data? Simple as Counting Your Fingers!
Imagine you have a big box of LEGOs. Some are red, some are blue, some are square, some are round. If you count how many red LEGOs you have, or describe the shape of the blue ones, you're collecting data!
Data is simply information, facts, or numbers collected for analysis or reference. Think of it as clues. Just like a detective collects clues to solve a mystery, we collect data to understand things better in our classroom.
- Analogy: Data is like the ingredients in a recipe. Each ingredient (flour, sugar, eggs) is a piece of data. When you put them all together, they help you understand and create the whole dish (the cake!).
- Classroom Example: Your grades on tests are data. The number of books you read in a month is data. Even your favorite subject can be data if we ask everyone!
Why Do We Collect Data in the Classroom? It's Like Having a Superpower!
Collecting data isn't just busywork; it's a powerful tool that helps everyone – students, teachers, and even parents. Here are the main reasons why we become classroom data detectives:
1. To Understand What's Happening
Think about a doctor checking your temperature when you feel sick. The temperature (data) helps the doctor understand if you have a fever. In the classroom, data helps us understand how well you're learning, what topics are easy, and what topics might need more explanation.
- Analogy: It's like checking the fuel gauge in a car. The gauge tells you how much gas is left (data) so you know if you need to stop for more.
- Classroom Example: A teacher might look at quiz scores to see if most students understood a new math concept.
2. To Make Smart Decisions
Once we understand what's happening, data helps us decide what to do next. If many students are struggling with a topic, the teacher might decide to review it again. If everyone understands it perfectly, the class can move on to something new!
- Analogy: It's like a coach looking at game statistics. If their team is missing too many free throws (data), the coach will decide to spend more practice time on free throws.
- Classroom Example: If data shows many students love reading about animals, the librarian might order more animal-themed books.
3. To Track Progress and Growth
Remember how you felt on the first day of school compared to now? You've grown a lot! Data helps us see that growth clearly. It's exciting to look back and see how much you've improved.
- Analogy: It's like marking your height on a doorframe every year. The marks (data) show how much you've grown over time.
- Classroom Example: Comparing your reading fluency score from September to May shows how much your reading speed and accuracy have improved.
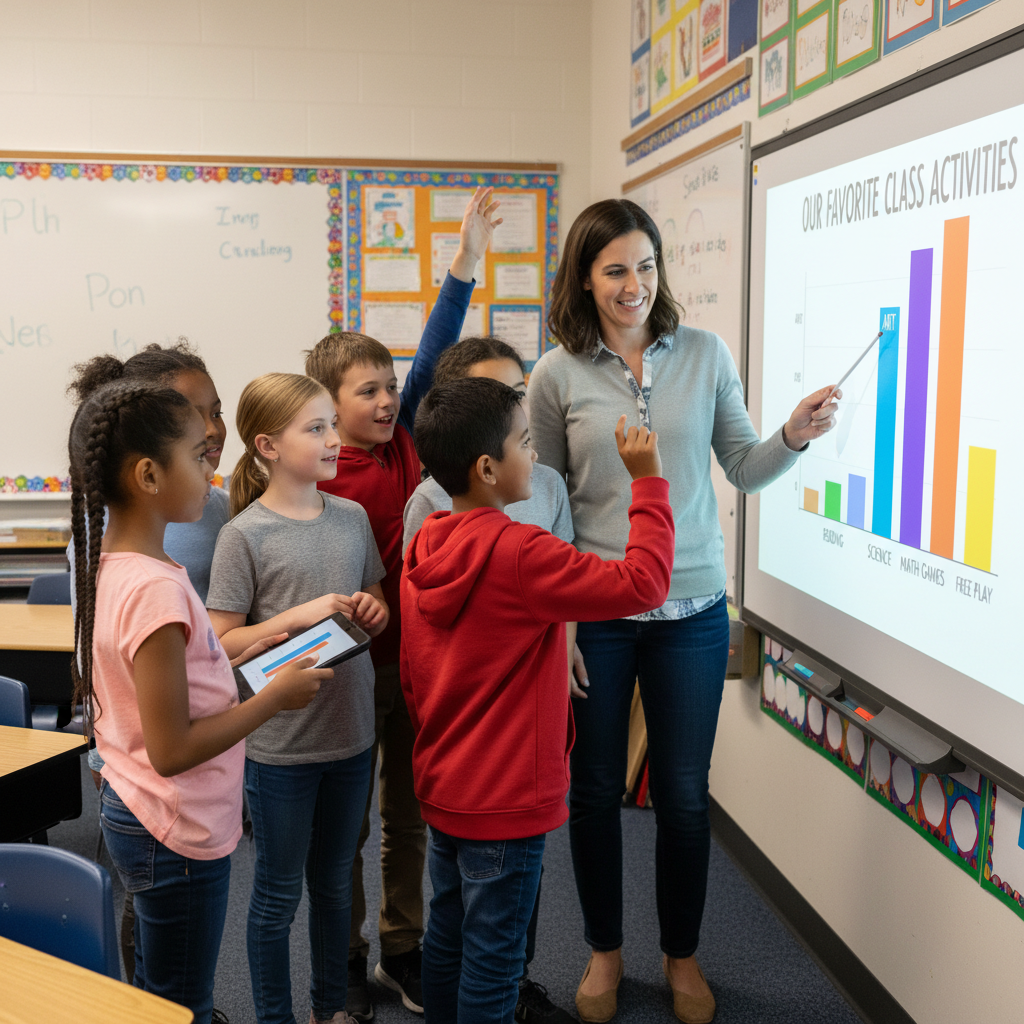 ⚠️ This picture may have spelling mistakes. Trust the words in the lesson.
Two Main Types of Classroom Data: Numbers vs. Descriptions
Not all data looks the same. Just like you can describe a LEGO by its color or by counting how many studs it has, data comes in different forms.
1. Quantitative Data (The Number Detective!)
This type of data is all about numbers. It's things you can count, measure, or express with a numerical value.
- Keywords: How many? How much? What is the score? What is the height/weight/speed?
- Analogy: Quantitative data is like counting the number of cookies in a jar, or measuring the length of your pencil. It's always about a specific quantity.
- Classroom Examples:
- Your score on a math test (e.g., 85 out of 100).
- The number of books you read last month (e.g., 4 books).
- The number of students present in class today (e.g., 28 students).
- How many minutes it took to complete an assignment.
2. Qualitative Data (The Description Detective!)
This type of data is all about descriptions, qualities, observations, and opinions. It helps us understand the 'why' and the 'how' behind things, rather than just the 'how many'.
- Keywords: How does it feel? What does it look like? Why did that happen? What are your thoughts?
- Analogy: Qualitative data is like describing the color, smell, or taste of a cookie. It's about what something is *like*, not how many there are.
- Classroom Examples:
- A student's comment about why they enjoyed a particular science experiment ("I loved seeing the volcano erupt!").
- A teacher's observation about how a group of students worked together on a project ("They collaborated very well and shared ideas").
- Your opinion on a book you just read ("It was exciting and hard to put down!").
- Describing the mood in the classroom during a certain activity.
How Do We Collect Data? Our Detective Tools!
Just like a detective uses different tools (magnifying glass, notepad), we use various methods to gather classroom data:
- Surveys and Questionnaires: This is like asking a group of friends, "What's your favorite color?" We ask questions to many people to get their opinions or facts. (e.g., "What's your favorite subject?", "How often do you read at home?")
- Observations: This means carefully watching and listening to what's happening. A teacher might watch how students work in groups to see how they collaborate. (e.g., noticing if students are on task, how they interact with peers).
- Tests and Quizzes: These are designed to measure your knowledge and understanding of a specific topic. The score tells us how much you've learned. (e.g., a spelling test, a chapter quiz in history).
- Counting/Tally Marks: Simply counting things! (e.g., how many times a student answers a question, how many books are borrowed from the classroom library).
- Interviews and Discussions: This involves talking one-on-one or in small groups to ask open-ended questions and gather detailed thoughts and feelings. (e.g., asking a student, "What was the most challenging part of this project and why?")
Organizing Our Data: Making Sense of the Clues!
Once you collect all these clues (data), it's important to organize them so they make sense. Imagine a detective with all their clues in a messy pile – hard to solve the mystery! We can use lists, charts (like bar graphs or pictographs), or tables to display data clearly.
- Analogy: It's like putting all your toys away in their proper bins. All the LEGOs go in one bin, all the action figures in another. This makes it easy to find what you need and see everything you have.
- Classroom Example: Creating a bar graph to show the class's favorite sports based on a survey.
Keeping Data Safe and Fair: The Data Detective's Promise
When we collect data about people, especially in a classroom, it's very important to be responsible. This means:
- Privacy: Keeping personal information private. Not everyone needs to know everyone else's test scores or personal opinions.
- Fairness: Using data to help everyone and not to unfairly judge or compare individuals. The goal is to support learning, not to make anyone feel bad.
Conclusion: You Are Now a Data Detective!
See? Data isn't scary or boring! It's a valuable tool that helps us understand, decide, and grow. By understanding what data is, why we collect it, and the different types and methods, you're already on your way to becoming a skilled classroom data detective. Keep an eye out for data all around you – it's everywhere!
Keep learning, free
Create a free Syllabax account to unlock practice questions and games for this topic.
Visual Learning Enhanced! 🚀
To help you master this topic, we use Advanced Syllabax AI to generate detailed diagrams and visual models.
Note on Visuals: The AI sometimes makes spelling errors in image labels. Please refer to the lesson text for the correct terminology.