What is Statistics?
Watch this topic in 60 seconds
Free preview · Lesson 1
Understanding What is Statistics?
Unlocking the Secrets of Numbers: What is Statistics? (Grade 5)
Hello, future data detectives! Have you ever wondered how we know what the most popular video game is, or how many students in your class prefer pizza over tacos? Or maybe you've seen charts in books or online showing how much it rained last month? All of these questions and answers are part of a super cool subject called Statistics!
What is Statistics? Your Everyday Number Detective!
Imagine you're a detective. What does a detective do? They look for clues, gather information, put it all together, and then figure out what happened, right? Well, that's exactly what Statistics is like, but instead of solving mysteries with footprints and fingerprints, we solve mysteries with numbers and information!
Think of it this way: Statistics is the science of collecting, organizing, analyzing, interpreting, and presenting data. It's like telling a story using numbers. With statistics, we can understand the world around us better, make smart decisions, and even predict what might happen in the future.

The Super Steps of Statistics:
Let's break down those big words into five simple steps, like following a recipe or building with LEGOs!
Step 1: Collecting Data – Gathering Your Clues!
Before you can solve any mystery, you need clues! In statistics, these clues are called data. Data is just a fancy word for information or facts. It could be numbers, words, or observations. For example:
- What are your classmates' favorite colors? (Data: red, blue, green, yellow...)
- How many pets does each family on your street have? (Data: 1 pet, 0 pets, 2 pets, 3 pets...)
- What are the temperatures each day for a week? (Data: 70 degrees, 72 degrees, 68 degrees...)
Analogy: Collecting data is like going on a scavenger hunt. You're looking for specific items (information) to bring back to solve a puzzle. You might ask people questions (surveys), observe things (like counting cars), or measure things (like height).
Step 2: Organizing Data – Putting Your Clues in Order!
Once you've collected all your clues, imagine if they were just scattered everywhere! It would be hard to make sense of them. So, the next step is to organize them. This means putting your data into neat groups or lists so it's easier to look at.
Analogy: Organizing data is like tidying up your toy box. You might put all the LEGOs in one bin, all the action figures in another, and all the board games on a shelf. This makes it easy to find what you're looking for!
You can use lists, tally marks, or simple tables to organize your data. For instance, if you asked about favorite colors, you'd list each color and then count how many people chose it.
Step 3: Displaying Data – Showing Off Your Clues!
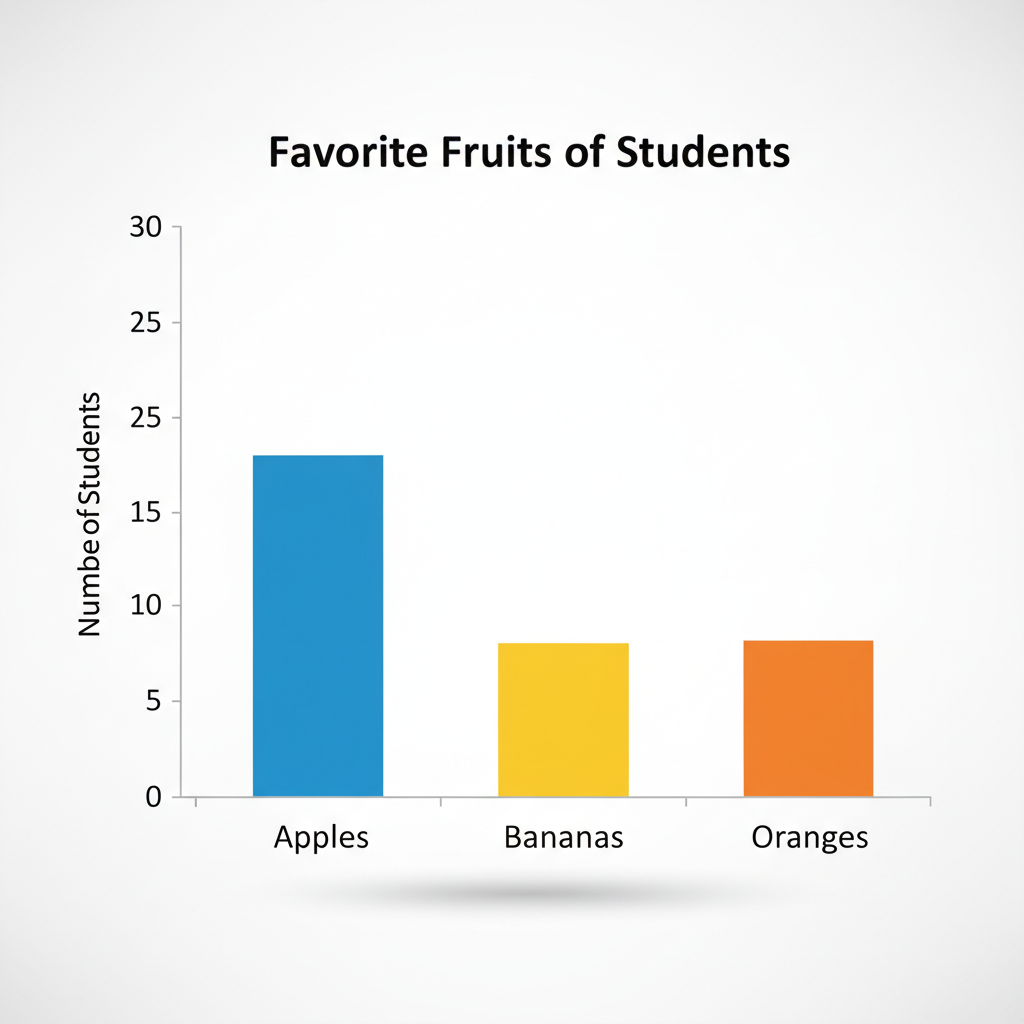
After your data is organized, it's time to show it to the world in a clear and exciting way! This is where we use things like charts and graphs. These visual tools help us see patterns and compare information quickly.
- Bar Graphs: Great for comparing different groups (e.g., how many choose red vs. blue).
- Pictographs: Use pictures to represent data (e.g., one smiley face equals 5 students).
- Line Graphs: Show how something changes over time (e.g., temperature changes throughout the day).
Analogy: Displaying data is like drawing a picture or creating a poster to tell your story. Instead of just a list of words, you create something colorful and easy to understand at a glance. It's much more interesting to see a picture of how many people like apples than just reading the number!
Step 4: Analyzing Data – What Do Your Clues Tell You?
Now that your data is all neat and tidy and displayed beautifully, it's time for the real detective work: analyzing! This means looking closely at your charts and graphs to find out what they tell you. Are there any big differences? Are some numbers much higher or lower than others? What's the most common answer?
Analogy: Analyzing data is like tasting a new recipe after all the ingredients are mixed and cooked. You taste it to figure out if it's sweet, sour, salty, or spicy, and what flavors stand out. You're trying to understand the 'flavor' of your numbers!
For example, if you see a very tall bar on a graph for 'pizza' as a favorite food, you analyze that to mean pizza is super popular!
Step 5: Interpreting/Making Conclusions – Solving the Mystery!
Finally, after all that hard work, you get to the most exciting part: interpreting your findings and making conclusions. This is where you summarize what you've learned and answer your original question. What does all this information mean? What's the big picture?
Analogy: Making conclusions is like solving the mystery or knowing if the recipe was a success. You can say, 'Based on our data, it looks like most students prefer pizza!' or 'We found out that it rained the most on Tuesday.' This helps you understand the world and make decisions.
Why is Statistics Important for You?
Statistics isn't just for grown-up scientists! It helps you every day:
- When you choose a team for a game based on who scored the most points last time.
- When you look at the weather report to decide what to wear.
- When you see a survey about the best snacks in the cafeteria.
- When you track your own progress in a video game!
Statistics gives you special powers to understand information better, ask smart questions, and think critically about what you see and hear. So, next time you see numbers and charts, remember, you're looking at the awesome world of statistics!
Keep learning, free
Create a free Syllabax account to unlock practice questions and games for this topic.
Visual Learning Enhanced! 🚀
To help you master this topic, we use Advanced Syllabax AI to generate detailed diagrams and visual models.
Note on Visuals: The AI sometimes makes spelling errors in image labels. Please refer to the lesson text for the correct terminology.