Tree Diagrams for Probability
Watch this topic in 60 seconds
Free preview · Lesson 1
Understanding Tree Diagrams for Probability
Understanding Probability with Tree Diagrams (Grade 9 - Foundational)
Welcome, young mathematicians! Today, we're going to explore a super cool and incredibly helpful tool in the world of probability: Tree Diagrams. Don't worry, we're not talking about actual trees with leaves and bark, but a special kind of diagram that helps us visualize and calculate the chances of different things happening. Think of it like a map for all the possible outcomes of an event!
What is Probability? A Quick Refresh
Before we dive into trees, let's quickly remember what probability is all about. Probability is simply a way of measuring how likely something is to happen. We usually express it as a number between 0 and 1, or as a percentage between 0% and 100%.
- A probability of 0 (or 0%) means something is impossible.
- A probability of 1 (or 100%) means something is certain to happen.
- A probability of 0.5 (or 50%) means it's equally likely to happen or not happen, like flipping a fair coin and getting heads.
Analogy: Imagine you have a bag of marbles. If all marbles are red, the probability of picking a red marble is 1 (certain). If there are no blue marbles, the probability of picking a blue marble is 0 (impossible). If half are red and half are blue, the probability of picking red is 0.5.
Why Do We Need Tree Diagrams?
Sometimes, we're interested in more than just one event. What if we want to know the probability of doing two or more things in a row? Like flipping a coin twice, or picking two cards from a deck? This is where tree diagrams become our best friends!
Analogy: Think of a tree diagram as a "choose your own adventure" story for probabilities. Each choice you make (like flipping a coin or picking a marble) is a branch, and each path leads to a different final outcome. It helps us see ALL the possible adventures and their likelihoods.
The Basic Building Blocks: Events and Outcomes
- Experiment: Any process that has a well-defined set of possible outcomes. (e.g., flipping a coin, rolling a die, drawing a card).
- Outcome: A single possible result of an experiment. (e.g., "Heads" when flipping a coin, "rolling a 3" when rolling a die).
- Event: A specific outcome or a group of outcomes we're interested in. (e.g., "getting an even number" when rolling a die, which includes outcomes 2, 4, and 6).
Independent vs. Dependent Events: Do They Talk to Each Other?
This is a super important distinction when dealing with multiple events:
Independent Events
These are events where the outcome of one does not affect the outcome of the other. They mind their own business!
Analogy: Imagine two friends, Alice and Bob, each flipping a coin. Alice's coin flip has absolutely no impact on Bob's coin flip. They are independent events.
Dependent Events
These are events where the outcome of one DOES affect the outcome of the other. They influence each other!
Analogy: Imagine you have a bag with a red and a blue marble. You pick one marble, and you don't put it back. Now, you pick a second marble. The probability of picking a certain color on your second try is different because the first marble is gone. The first pick affected the second pick.
How to Build a Tree Diagram: Step-by-Step
Let's break down how to construct these powerful diagrams.
- Start with a Dot (The Root): This represents the beginning of your sequence of events.
-
First Event's Branches: From your starting dot, draw branches for each possible outcome of your first event.
- Label each branch with the outcome it represents.
- Write the probability of that outcome happening on the branch itself.
- Make sure the probabilities on all branches from a single point add up to 1 (or 100%).
-
Second Event's Branches (and beyond!): From the end of each branch of the first event, draw new branches for the possible outcomes of the second event.
- Again, label outcomes and their probabilities.
- Crucial Point: If the events are dependent, these probabilities will change based on the outcome of the first event. If independent, they stay the same.
- List All Final Outcomes: At the very end of each path (the "leaves" of your tree), write down the complete sequence of outcomes for that path.
Using Your Tree Diagram: Reading the Map
Once your tree diagram is built, you can use it to calculate probabilities:
- Probability of a Specific Sequence: To find the probability of following a particular path (e.g., getting Heads then Tails), you multiply the probabilities along that path. Think of it as "AND" – the probability of A and B happening.
- Probability of an Event with Multiple Sequences: If an event can happen in more than one way (e.g., getting exactly one Head in two flips, which could be HT or TH), you calculate the probability of each relevant path and then add them together. Think of it as "OR" – the probability of Path 1 or Path 2 happening.
Example 1: Independent Events - Flipping a Coin Twice
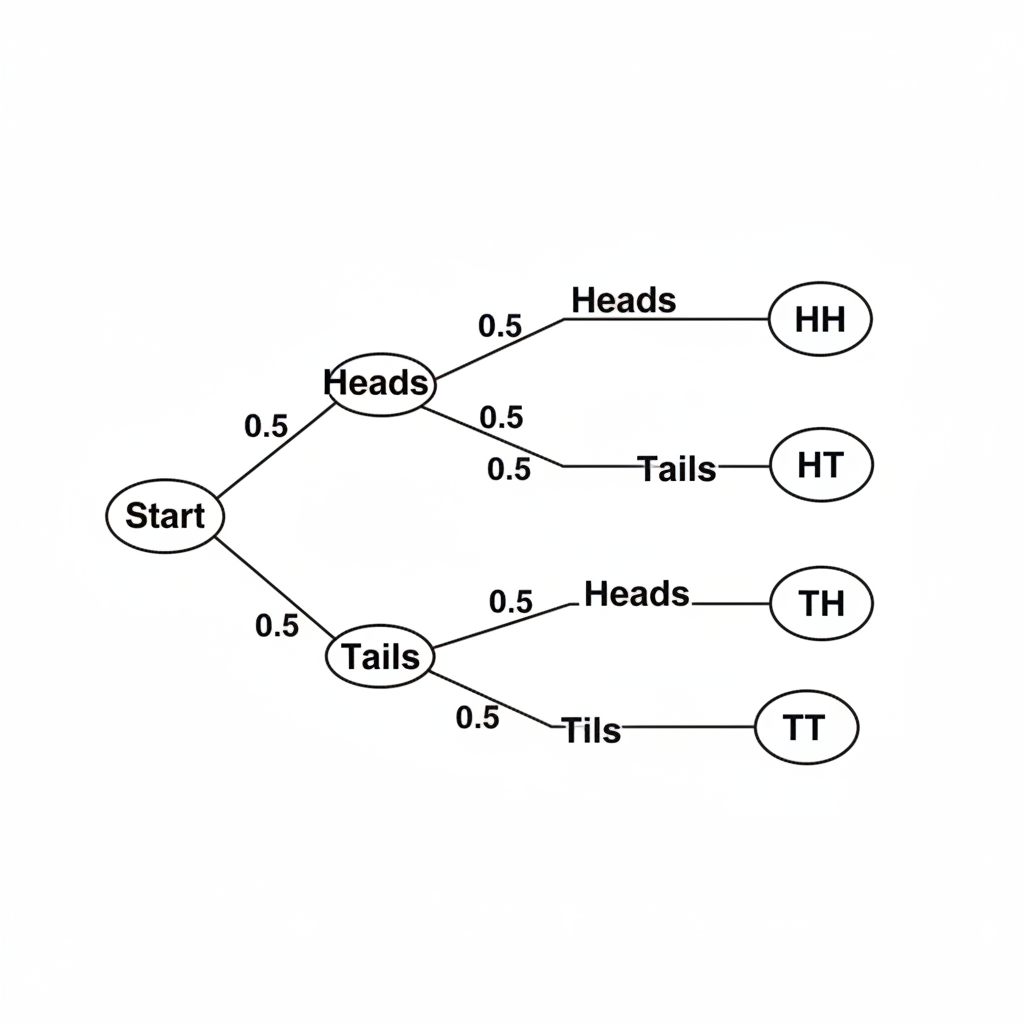
Let's say you flip a fair coin two times. What are the probabilities of all possible outcomes?
- First Flip: Heads (H) or Tails (T). Probability for each is 1/2.
- Second Flip: Heads (H) or Tails (T). Since the first flip doesn't affect the second, probabilities are still 1/2 for each.
 ⚠️ This picture may have spelling mistakes. Trust the words in the lesson.
Let's trace the paths:
- Path 1: Heads then Heads (HH)
- Probability = P(H on 1st flip) * P(H on 2nd flip) = (1/2) * (1/2) = 1/4
- Path 2: Heads then Tails (HT)
- Probability = P(H on 1st flip) * P(T on 2nd flip) = (1/2) * (1/2) = 1/4
- Path 3: Tails then Heads (TH)
- Probability = P(T on 1st flip) * P(H on 2nd flip) = (1/2) * (1/2) = 1/4
- Path 4: Tails then Tails (TT)
- Probability = P(T on 1st flip) * P(T on 2nd flip) = (1/2) * (1/2) = 1/4
Notice that if you add all these final probabilities (1/4 + 1/4 + 1/4 + 1/4), you get 1, which means we've accounted for all possible outcomes!
What is the probability of getting exactly one head? This can happen in two ways: HT or TH. P(exactly one head) = P(HT) + P(TH) = 1/4 + 1/4 = 2/4 = 1/2.
Example 2: Dependent Events - Drawing Marbles Without Replacement
Imagine a bag contains 3 red marbles (R) and 2 blue marbles (B). You draw one marble, don't put it back, and then draw a second marble. What are the probabilities?
First Draw:
- Total marbles: 5
- P(Red on 1st draw) = 3/5
- P(Blue on 1st draw) = 2/5
Second Draw (This is where it gets dependent!):
The probabilities for the second draw change based on what was drawn first.
-
If Red was drawn first:
- Remaining marbles: 2 Red, 2 Blue (Total 4)
- P(Red on 2nd | Red on 1st) = 2/4
- P(Blue on 2nd | Red on 1st) = 2/4
-
If Blue was drawn first:
- Remaining marbles: 3 Red, 1 Blue (Total 4)
- P(Red on 2nd | Blue on 1st) = 3/4
- P(Blue on 2nd | Blue on 1st) = 1/4
Let's trace the paths:
- Path 1: Red then Red (RR)
- Probability = P(R on 1st) * P(R on 2nd | R on 1st) = (3/5) * (2/4) = 6/20 = 3/10
- Path 2: Red then Blue (RB)
- Probability = P(R on 1st) * P(B on 2nd | R on 1st) = (3/5) * (2/4) = 6/20 = 3/10
- Path 3: Blue then Red (BR)
- Probability = P(B on 1st) * P(R on 2nd | B on 1st) = (2/5) * (3/4) = 6/20 = 3/10
- Path 4: Blue then Blue (BB)
- Probability = P(B on 1st) * P(B on 2nd | B on 1st) = (2/5) * (1/4) = 2/20 = 1/10
Again, adding all final probabilities: 3/10 + 3/10 + 3/10 + 1/10 = 10/10 = 1.
What is the probability of drawing one red and one blue marble? This can happen in two ways: RB or BR. P(one Red, one Blue) = P(RB) + P(BR) = 3/10 + 3/10 = 6/10 = 3/5.
Conclusion: Your Probability Power-Up!
Tree diagrams are fantastic tools for breaking down complex probability problems into smaller, manageable steps. They help you:
- Visualize: See all possible outcomes clearly.
- Organize: Keep track of probabilities at each stage.
- Calculate: Easily find the probability of specific sequences or combined events.
Keep practicing, and you'll master this skill in no time!
Keep learning, free
Create a free Syllabax account to unlock practice questions and games for this topic.
Visual Learning Enhanced! 🚀
To help you master this topic, we use Advanced Syllabax AI to generate detailed diagrams and visual models.
Note on Visuals: The AI sometimes makes spelling errors in image labels. Please refer to the lesson text for the correct terminology.