Real-World Statistical Applications
Watch this topic in 60 seconds
Free preview · Lesson 1
Understanding Real-World Statistical Applications
Real-World Statistical Applications: Unveiling the Power of Data Around Us
Welcome, future data detectives! Have you ever wondered how scientists predict weather, how companies know what products you might like, or how sports teams decide their strategies? The secret often lies in a powerful tool called statistics. In this guide, we'll embark on an exciting journey to understand how statistics, often seen as just numbers, are actually a vibrant language that helps us make sense of the world around us. Think of statistics as a special pair of glasses that helps us see patterns and stories hidden within everyday information.
What is Statistics, Anyway?
At its heart, statistics is the science of collecting, organizing, analyzing, interpreting, and presenting data. Don't let those big words scare you! Imagine you're a detective. Your job is to solve a mystery. To do that, you gather clues (data), organize them, look for patterns (analyze), figure out what they mean (interpret), and then present your findings to solve the case. That's exactly what statistics does, but with numbers and facts!
Analogy: Statistics as a Detective's Toolkit
Just like a detective uses magnifying glasses, fingerprint kits, and witness interviews, statisticians use surveys, experiments, charts, and calculations to uncover truths from data.
The Building Blocks: Understanding Data
Everything in statistics starts with data. Data is simply information, facts, or observations. It's the raw material we work with.
-
Quantitative Data: The 'How Many' and 'How Much'
This type of data can be counted or measured numerically. Think of it as anything you can express with numbers that make sense to perform mathematical operations on.
- Examples: The number of students in your class, your height in centimeters, the temperature outside, the score of a basketball game.
-
Qualitative Data: The 'What Kind' and 'Which Category'
Also known as categorical data, this describes qualities or characteristics that cannot be measured numerically. It's about grouping things into categories.
- Examples: Your favorite color (red, blue, green), the type of car you drive (sedan, SUV, truck), whether a movie is good or bad, your hair color.
Analogy: Data as Ingredients in a Recipe
Think of baking a cake. Flour, sugar, eggs, and milk are your data points. Some ingredients (like flour) you measure precisely (quantitative), while others (like 'a pinch of salt') are more about quality or presence (qualitative).
Population vs. Sample: Who Are We Studying?
When we want to understand something, we often talk about a population. The population is the entire group you want to draw conclusions about. It could be all students in your school, all trees in a forest, or all customers of a certain brand.
However, studying an entire population can be huge, expensive, and sometimes impossible! Imagine trying to ask every single person in your country their opinion on a new law. That's why we often use a sample. A sample is a smaller, manageable group selected from the population. The goal is for this sample to be representative, meaning it accurately reflects the characteristics of the larger population.
Analogy: Tasting a Spoonful of Soup
Imagine your mom makes a big pot of soup. To know if it needs more salt, you don't eat the whole pot, right? You taste a spoonful. That spoonful is your sample, and the entire pot of soup is the population. If the spoonful tastes good, you assume the whole pot tastes good.
Descriptive Statistics: Summarizing and Describing Data
Once you've collected your data, the first thing you do is try to describe it. This is where descriptive statistics come in. They help us organize, summarize, and present data in a meaningful way. We're not making big predictions yet; we're just laying out the facts clearly.
Measures of Central Tendency: What's Typical?
These tell us about the 'center' or 'average' value of a dataset. They help us understand what a 'typical' piece of data looks like.
-
Mean (The Average): This is what most people think of when they hear 'average.' You add up all the values and divide by the number of values. It's like sharing everything equally among the group.
Analogy: Fair Share
If you and three friends each have a different number of cookies (2, 5, 3, 6), the mean tells you how many cookies each person would get if you pooled them all together and shared them equally (2+5+3+6 = 16 cookies, divided by 4 friends = 4 cookies each). -
Median (The Middle Child): When you arrange all your data points from smallest to largest, the median is the value exactly in the middle. If there's an even number of data points, it's the average of the two middle ones. The median is great because it's not easily affected by extremely high or low values (outliers).
Analogy: The Middle Child
Imagine a family of five children lined up by height. The child in the middle is the median height. Extreme heights of the tallest or shortest child won't dramatically shift the middle child's position. -
Mode (The Most Popular): This is the value that appears most frequently in a dataset. There can be one mode, multiple modes, or no mode at all if every value appears only once.
Analogy: The Popular Choice
If you ask your classmates what their favorite ice cream flavor is, the flavor chosen by the most students is the mode. It's the most popular!
Measures of Variability: How Spread Out is the Data?
While central tendency tells us what's typical, measures of variability tell us how spread out or dispersed the data points are. Are they all clustered together, or are they scattered far apart?
-
Range: This is the simplest measure of spread. You just subtract the smallest value from the largest value in your dataset. It gives you a quick idea of the total span of your data.
Analogy: How Far Apart Your Friends Live
If your friend group lives between 1 mile and 10 miles from school, the range is 9 miles. It tells you the total distance covered by where everyone lives, but not how they're distributed within that distance. - (Briefly mention) Standard Deviation: This is a more advanced concept, but essentially, it tells you the average distance each data point is from the mean. A small standard deviation means data points are close to the mean, while a large one means they are more spread out.
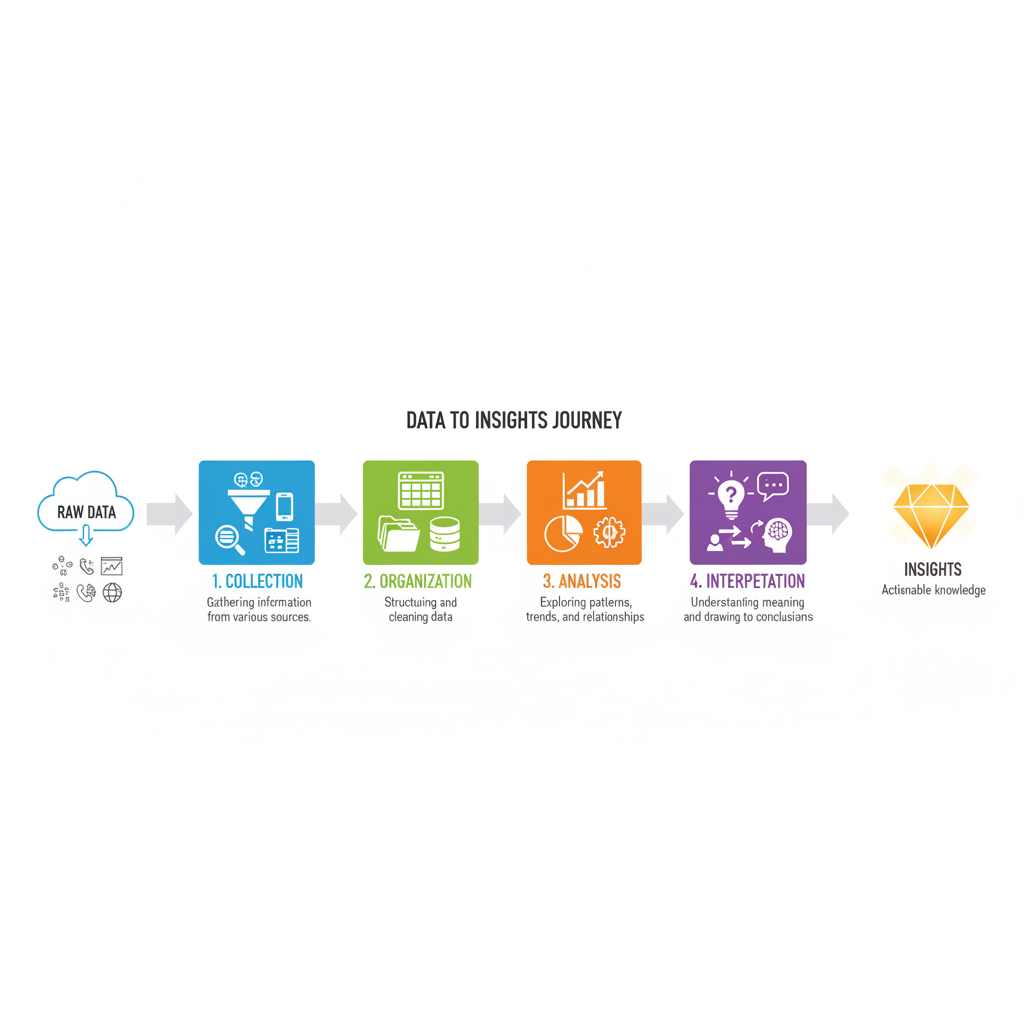 ⚠️ This picture may have spelling mistakes. Trust the words in the lesson.
Inferential Statistics: Making Smart Guesses and Predictions
After describing your sample data, you often want to make bigger statements – statements about the entire population. This is where inferential statistics comes in. It uses complex calculations and probability to draw conclusions and make predictions about a population based on what you observed in your sample.
Analogy: Predicting the Weather
When a meteorologist predicts tomorrow's weather, they don't observe *every single cloud* or *every single air molecule* on Earth. Instead, they take samples (data from weather stations, satellites), analyze those samples, and then infer (predict) what the weather will likely be for a much larger area. They can't be 100% certain, but they can be pretty confident based on their data.
Real-World Statistical Applications: Where Do We See This?
Statistics isn't just for mathematicians in labs; it's everywhere! Here are a few examples:
-
In Business and Marketing:
Companies use statistics to understand customer preferences. They might survey a sample of people to find out what new product features they like (e.g., 'What color phone do you prefer?'). This helps them decide what to produce and how to advertise. They also use statistics to predict sales trends and manage inventory.
-
In Healthcare and Medicine:
Doctors and researchers use statistics to test new medicines. They give a new drug to a sample of patients and a placebo (dummy pill) to another sample. By comparing the results, they can determine if the drug is effective and safe. They also track disease prevalence (how common a disease is) to understand public health trends.
-
In Government and Policy:
Governments use statistics to track unemployment rates, economic growth, and population changes (through censuses). This data helps them make informed decisions about job creation, public services, and infrastructure projects.
-
In Sports:
Coaches and analysts use statistics to evaluate player performance, strategize for games, and even scout new talent. Batting averages, free-throw percentages, and possession statistics are all forms of data used to make decisions.
-
In Education:
Teachers and educators use statistics to analyze test scores, understand which teaching methods are most effective, and identify areas where students might need extra help. For example, they might look at the average score on a test to gauge overall class understanding.
A Word of Caution: Misleading Statistics
While statistics are incredibly useful, they can also be misused or misinterpreted, sometimes intentionally. For example, a graph might be drawn with a 'stretched' y-axis to make a small change look like a huge jump. It's crucial to always question the source of data, how it was collected, and how it's being presented.
Analogy: A Distorted Mirror
Statistics can be like a mirror reflecting reality. But if the mirror is distorted, it can show a warped image. Always check for distortions!
Conclusion: Your Statistical Superpower
By understanding these foundational concepts – what data is, how to differentiate between populations and samples, and how descriptive and inferential statistics work – you're well on your way to developing a crucial skill for the 21st century. Statistics isn't just about crunching numbers; it's about making smarter decisions, understanding complex information, and becoming a more informed citizen in a data-rich world. So, keep asking questions, keep looking for patterns, and unleash your inner data detective!
Keep learning, free
Create a free Syllabax account to unlock practice questions and games for this topic.
Visual Learning Enhanced! 🚀
To help you master this topic, we use Advanced Syllabax AI to generate detailed diagrams and visual models.
Note on Visuals: The AI sometimes makes spelling errors in image labels. Please refer to the lesson text for the correct terminology.