Reading Simple Circle Graphs
Watch this topic in 60 seconds
Free preview · Lesson 1
Understanding Reading Simple Circle Graphs
Reading Simple Circle Graphs: A Pie-tastic Adventure!
Hey there, young learners! Get ready for a super fun adventure into the world of circle graphs. Think of it like looking at a delicious pizza or a yummy pie. Just like a pizza has different slices, a circle graph shows us different 'slices' of information! It's an awesome way to see how a whole thing is divided into smaller parts.
What is a Circle Graph? (It's Like a Pizza!)
Imagine you have a whole pizza. That whole pizza is everything – it's 100% of your pizza. Now, what if you cut that pizza into different slices? Some slices might be bigger, some might be smaller, depending on who wants what topping!
A circle graph (sometimes called a pie chart because it looks like a pie!) is exactly like that. It's a circle that represents a whole group or a whole amount of something. Then, it's divided into different 'slices' or sections. Each slice shows a part of that whole. It helps us quickly see which part is bigger, which is smaller, and how everything adds up.
Why Do We Use Circle Graphs?
Circle graphs are super helpful because they make it easy to compare different parts of a whole thing. Let's say you want to know how your classmates get to school. Instead of just a list of numbers, a circle graph can show you a quick picture: 'Wow, most kids walk!' or 'A lot of kids take the bus!' It's a visual way to understand information quickly.
The Important Parts of a Circle Graph (Knowing Your Pizza Slices!)
Just like a pizza has crust, cheese, and toppings, a circle graph has a few main parts you need to know:
-
The Whole Circle (The Entire Pizza!)
The entire circle always represents the whole group or the total amount of whatever the graph is about. It's like the entire pizza before you eat any slices. In percentages, the whole circle is always 100%. This is super important to remember!
Analogy: If the graph is about 'Favorite Pets of Class 5A', the whole circle represents ALL the students in Class 5A.
-
Slices or Sectors (The Delicious Slices!)
The circle is divided into different sections, which we call slices or sectors. Each slice represents a different category or part of the whole. The size of the slice shows how big that part is compared to the other parts and the whole.
Analogy: If your pizza has slices of pepperoni, cheese, and veggie, each of those is a 'slice' on your pizza, just like each category is a 'slice' on your graph.
-
Labels (What's on Each Slice?)
Each slice usually has a label. This label tells you what that particular slice represents. Without labels, you wouldn't know if a slice meant 'dogs' or 'cats' or 'pizza'! Sometimes, there's also a key or a legend next to the graph that uses different colors for different categories and tells you what each color means.
Analogy: The label on your pizza box might say 'Pepperoni Pizza'. On the graph, a label might say 'Walking' for kids who walk to school.
-
Percentages (How Big is the Slice?)
Most circle graphs will show a percentage (%) inside or next to each slice. A percentage tells you what part of the whole that slice represents, out of 100. For example, if a slice says '25%', it means that part makes up 25 out of every 100 parts of the whole.
Remember: All the percentages in a circle graph must always add up to 100%. If they don't, something is wrong!
Analogy: If 50% of your allowance goes to toys, that's half of your money! If 25% goes to snacks, that's a quarter. Together, 50% + 25% + any other parts should equal 100% of your allowance.
-
Title of the Graph (What's the Pizza Party About?)
Every good graph needs a title. The title tells you what the entire graph is about. It's like the name of your pizza party – 'Favorite Ice Cream Flavors' or 'How We Spend Our Saturday'. Always read the title first!
How to Read a Simple Circle Graph (Your Step-by-Step Guide!)
Reading a circle graph is easy once you know these steps. Let's look at an example!
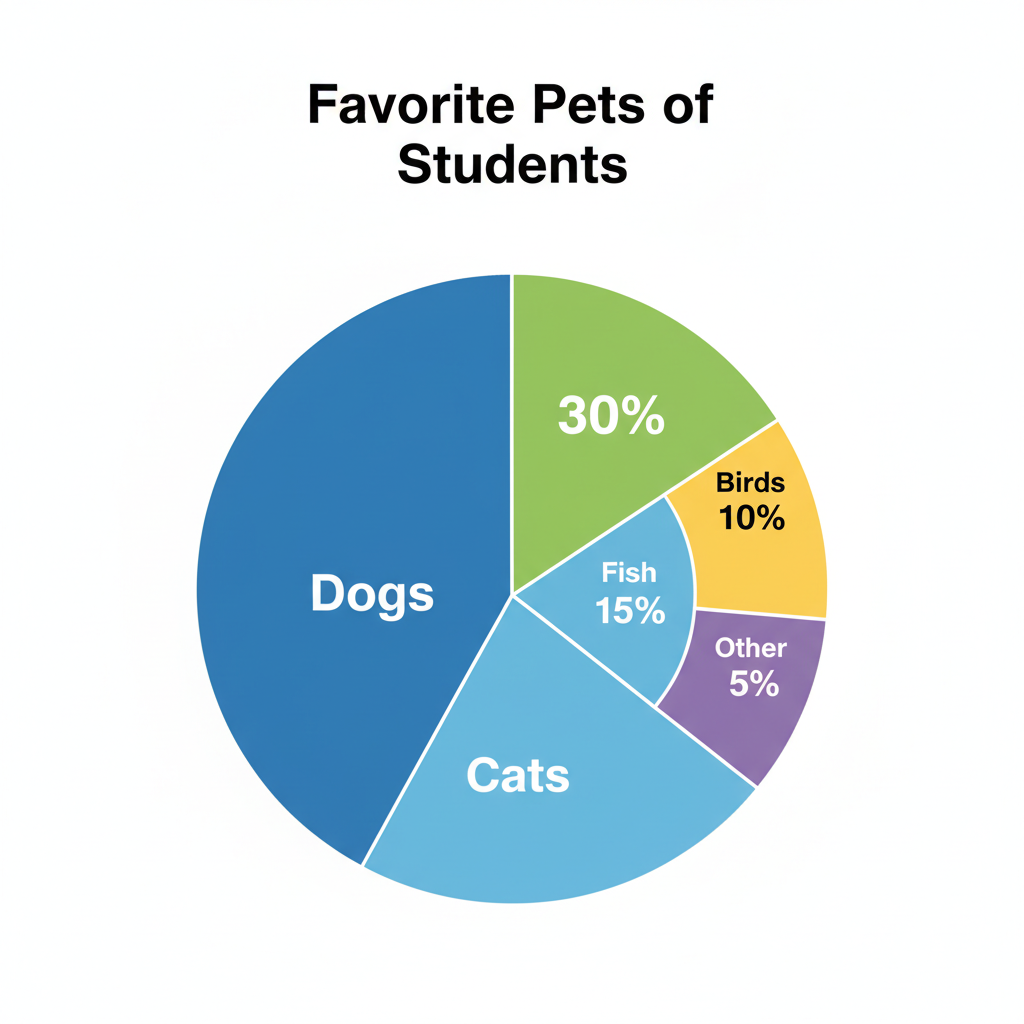
Let's break down how to read this graph:
- Read the Title: The title is "Favorite Pets of Class 5B." This tells us exactly what information the graph is showing – it's about what pets students in Class 5B like best.
- Look at the Slices and Labels: We can see different slices. One slice is labeled "Dogs," another "Cats," then "Fish," "Birds," and "Other."
-
Find the Percentages: Next to each label, there's a percentage:
- Dogs: 40%
- Cats: 30%
- Fish: 15%
- Birds: 10%
- Other: 5%
-
Understand What It Means:
- 40% of the students in Class 5B prefer dogs.
- 30% prefer cats.
- 15% prefer fish, and so on.
- Compare the Slices: Now you can easily compare! Which is the most popular pet? Dogs (40%)! Which is the least popular? Other (5%). You can also see that dogs and cats together make up 70% (40% + 30%) of the favorite pets, which is a big majority!
See? It's like a superpower for understanding data!
Another Example: How a Child Spends Their Summer Day!
Let's look at one more example to make sure you're a circle graph superstar!
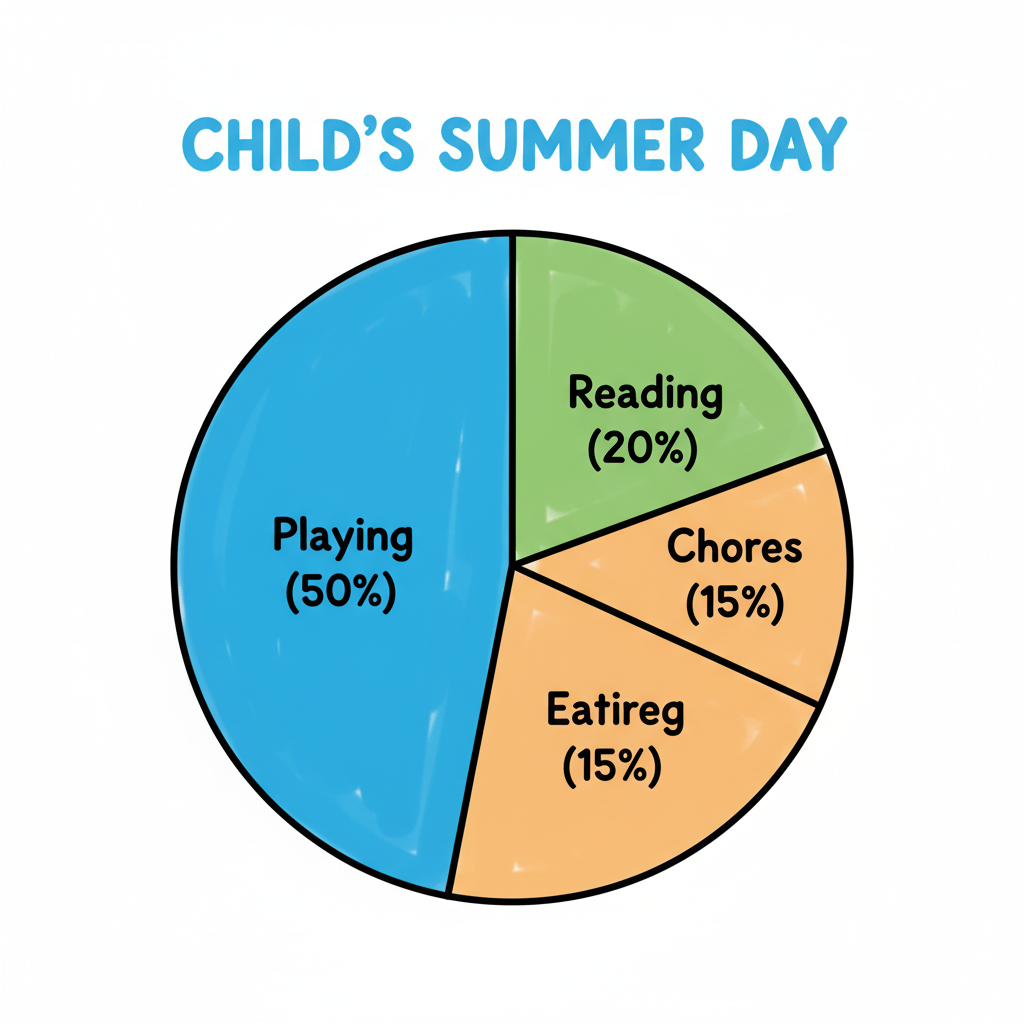 ⚠️ This picture may have spelling mistakes. Trust the words in the lesson.
This graph shows "Summer Day Activities." It tells us how one child spends their time during a summer day. Let's practice reading it:
- Title: Summer Day Activities. (Okay, this graph is about how a child spends their day.)
- Slices & Labels: Playing, Reading, Chores, Eating.
- Percentages:
- Playing: 50%
- Reading: 20%
- Chores: 15%
- Eating: 15%
- What does this tell us? This child spends half (50%) of their summer day playing! They spend an equal amount of time on chores and eating (15% each). Reading takes up 20% of their day.
- Comparisons: Playing takes up much more time than any other activity. Reading takes up more time than chores or eating.
You're a Circle Graph Expert!
Congratulations! You now know how to read simple circle graphs. Remember, they are just circles divided into slices, showing parts of a whole. Each slice has a label and usually a percentage, and everything adds up to 100%. Keep practicing, and you'll be able to understand all sorts of information presented in these cool charts!
Keep learning, free
Create a free Syllabax account to unlock practice questions and games for this topic.
Visual Learning Enhanced! 🚀
To help you master this topic, we use Advanced Syllabax AI to generate detailed diagrams and visual models.
Note on Visuals: The AI sometimes makes spelling errors in image labels. Please refer to the lesson text for the correct terminology.