Learning Journey
Watch this topic in 60 seconds
Free preview · Lesson 1
Understanding Interpreting Tally Data
Let's Unravel Tally Data! (A Fun Way to Count!)
Hello, young mathematicians! Have you ever tried to count a lot of things, like how many red cars you see on the way to school, or how many friends like pizza? Sometimes, just making a big pile of numbers can get confusing. That's where tally marks come to save the day!
Imagine you have a super important job: counting all the bouncy balls in a big basket. You could just write down '1, 2, 3...' but if there are many, many balls, you might lose your place. Tally marks are like making neat little checkmarks for each thing you count, making it super easy to keep track!
What Are Tally Marks?
A tally mark is just a straight line, like this: |. Each line means 'one' of something. If you count one bouncy ball, you make one line. If you count another bouncy ball, you make another line next to it, like this: ||. For three, it's |||. For four, it's ||||.
The Super Special 'Group of Five'!
Now, here's where tally marks get really clever! When you get to the fifth thing you count, you don't just add another straight line. Instead, you draw a diagonal line right across the first four lines, like this: ////
Think of it like giving a 'high-five' with your hand! You have four fingers up, and then your thumb goes across to make a group of five. This bundle of five lines is super special because it makes counting much, much faster! Instead of counting 'one, two, three, four, five' every time, you can just see that bundle and say 'FIVE!'
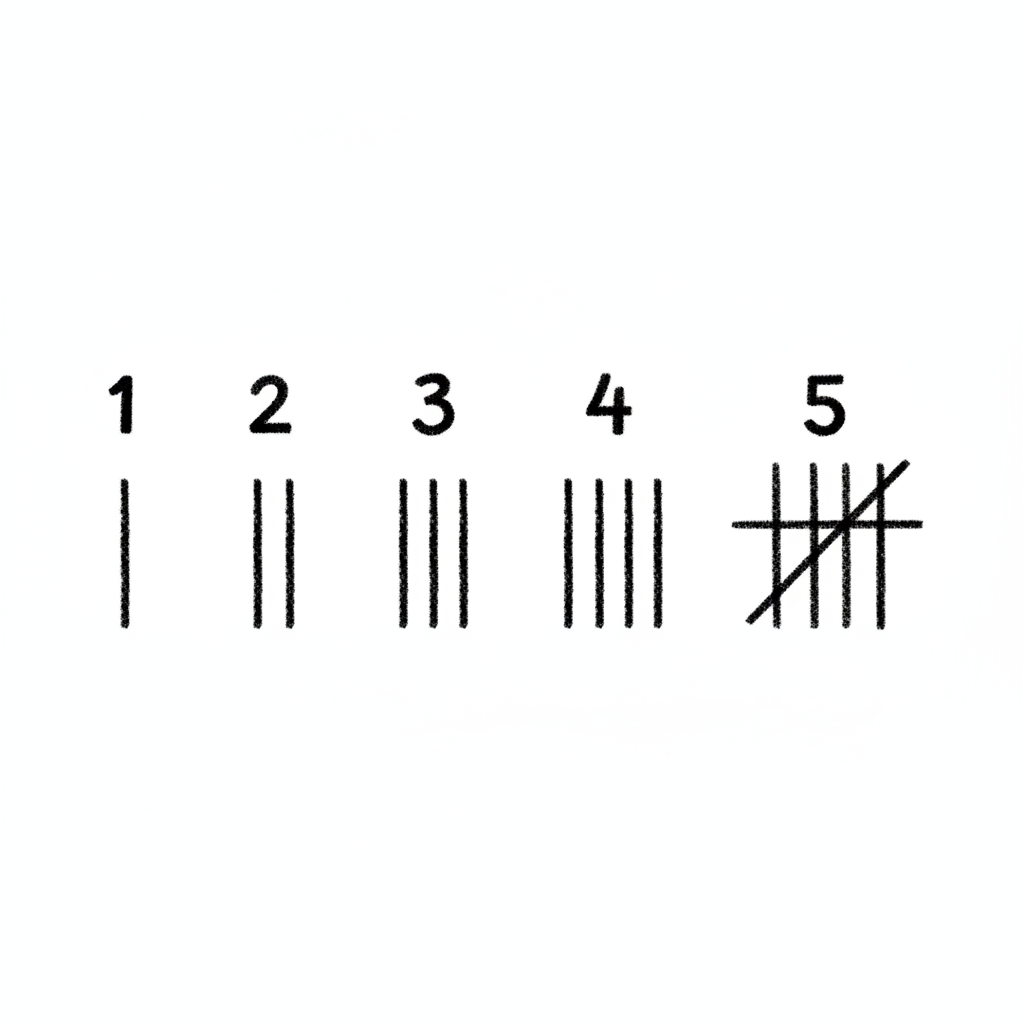
Why is making a group of five so helpful? Imagine you're counting a huge pile of candies. It's much easier to count groups of five than to count each single candy. It's like having little rubber bands around groups of five sticks – you can easily see how many bundles you have!
Reading Tally Charts: Unlocking the Secret Code!
When we 'interpret' tally data, it means we are figuring out what the tally marks are telling us. It's like being a detective and solving a number mystery!
To read tallies, you just need to remember the special 'group of five':
- First, look for all the groups of five (
//// - Then, count any extra single lines (
|) that are left over. - Add them all together to get your total number!
Let's try some examples:
||means 1 + 1 = 2||||means 1 + 1 + 1 + 1 = 4////////|////|||////////
Looking at a Whole Tally Chart!
Sometimes, people use tally marks to make a 'tally chart'. This is like a special table that shows how many people like different things, or how many of different items there are. Let's look at an example of a tally chart showing favorite fruits:
Favorite Fruits Survey
| Fruit | Tally Marks | Total Count |
|---|---|---|
| Apples | |
|
| Bananas | |
|
| Oranges | |||| |
Let's be fruit detectives and fill in the 'Total Count' column:
- Apples: We see one group of five (
////||). So, 5 + 2 = 7 people like apples. - Bananas: We see two groups of five (
////////|). So, 5 + 5 + 1 = 11 people like bananas. - Oranges: We see four single lines (
||||). So, 1 + 1 + 1 + 1 = 4 people like oranges.
Comparing Tally Data: Who Won?
Once you've changed the tallies into numbers, you can easily compare them! Using our fruit survey example:
- Which fruit is the most popular? Bananas (11 votes) are the most popular!
- Which fruit is the least popular? Oranges (4 votes) are the least popular.
- How many more people like Apples than Oranges? We compare 7 (Apples) and 4 (Oranges). 7 - 4 = 3. So, 3 more people like apples than oranges.
Putting it All Together!
Tally marks are a fantastic tool for counting and organizing information. They help us turn a jumble of observations into clear numbers, which we can then use to answer questions and understand our world better. Just remember the 'group of five' and you'll be a tally expert in no time!
Keep practicing, and soon you'll be able to read any tally chart like a pro!
Keep learning, free
Create a free Syllabax account to unlock practice questions and games for this topic.
Visual Learning Enhanced! 🚀
To help you master this topic, we use Advanced Syllabax AI to generate detailed diagrams and visual models.
Note on Visuals: The AI sometimes makes spelling errors in image labels. Please refer to the lesson text for the correct terminology.