Learning Journey
Watch this topic in 60 seconds
Free preview · Lesson 1
Understanding Reading & interpreting data [Data Representation]
Reading and Interpreting Data: Seeing the Story in Numbers!
Welcome, super data detectives! Have you ever looked at a chart or a graph and wondered, "What is this telling me?" That's what we're going to learn today! We're going to become experts at reading and understanding data, which is just a fancy word for information, like numbers, words, or pictures that help us learn about something. Think of data as clues at a mystery scene – we need to look at them carefully to solve the mystery!
What is Data Representation?
Imagine you have a big pile of LEGO bricks of different colors: red, blue, yellow, and green. How would you show your friend how many of each color you have? You could count them all up and say, "I have 10 red, 5 blue, 7 yellow, and 3 green." That's one way to represent your data! But what if you had hundreds of bricks? It would be hard to say it all out loud, and it might be hard for your friend to remember.
Data representation is like organizing those LEGO bricks so they are easy to see and understand. It's about showing information in a way that makes sense. We can show data in many ways, just like you could arrange your LEGO bricks:
- In a list: Like we just did with the colors.
- In a chart or a graph: These are like pictures made from the numbers. They help us see patterns and compare things quickly.
Think of it like this: when you're telling a story, you don't just say a bunch of words; you put them together in sentences and paragraphs so the story makes sense. Data representation does the same thing for information – it puts the numbers and facts into a structure so we can understand the story they are telling.
Types of Data Representation: Our Detective Tools!
Let's explore some common ways we represent data. These are like the special tools in our detective kit!
1. Bar Graphs: Like Stacking Blocks!
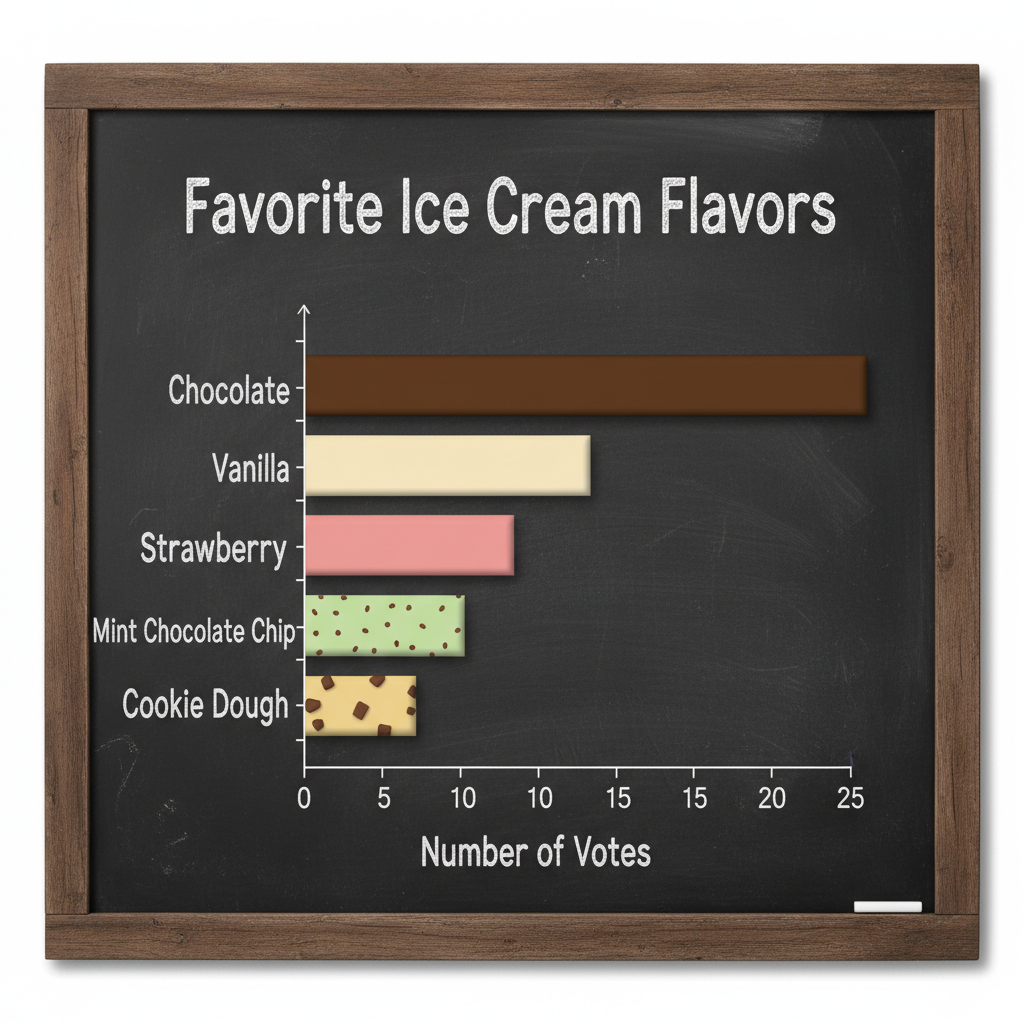
A bar graph uses rectangular bars to show and compare data. Imagine you asked your classmates about their favorite ice cream flavors. You could make a bar graph to show the results. Each flavor would have its own bar, and the height of the bar would show how many people chose that flavor.
Example: Favorite Ice Cream Flavors
- Chocolate: 12 votes
- Vanilla: 8 votes
- Strawberry: 5 votes
- Mint Chip: 10 votes
On a bar graph, you would have labels for each flavor along the bottom (the x-axis) and numbers going up the side (the y-axis) to show the count of votes. The taller the bar, the more popular the flavor!
Analogy: Think of stacking blocks. If chocolate is the most popular, its tower of blocks will be the tallest. If strawberry is the least popular, its tower will be the shortest.
 ⚠️ This picture may have spelling mistakes. Trust the words in the lesson.
With a bar graph, we can easily see which flavor is the most popular (Chocolate!) and which is the least popular (Strawberry!). We can also compare how many people liked Chocolate versus Vanilla.
2. Pictographs: Pictures Tell a Story!
A pictograph uses pictures or symbols to represent data. Instead of just numbers, we use little drawings. This makes data very fun to look at, especially for younger learners.
Example: Books Read in a Week
- Sarah: 5 books
- Tom: 3 books
- Emily: 7 books
In a pictograph, we might use a small picture of a book to represent one book read. So, Sarah would have 5 book pictures next to her name, Tom would have 3, and Emily would have 7. Sometimes, one picture might represent more than one thing. For example, one book picture could stand for 2 books read, so Sarah would need 2 and a half book pictures!
Analogy: Imagine you're collecting stickers. A pictograph is like arranging your stickers to show how many of each kind you have. Each sticker is a piece of data!
3. Line Graphs: Following the Path!
A line graph is perfect for showing how something changes over time. Think about how your height changes as you grow, or how the temperature changes throughout the day.
Example: Daily Temperature
- Morning (9 AM): 60 degrees
- Afternoon (1 PM): 75 degrees
- Evening (6 PM): 68 degrees
- Night (10 PM): 62 degrees
On a line graph, we plot points for each time and temperature. Then, we connect these points with a line. This line shows us the "path" of the temperature. You can easily see if it went up, down, or stayed the same.
Analogy: Imagine you're drawing a path on a map. The line graph shows the path of the temperature from morning to night. You can see if the path went uphill (temperature increased) or downhill (temperature decreased).
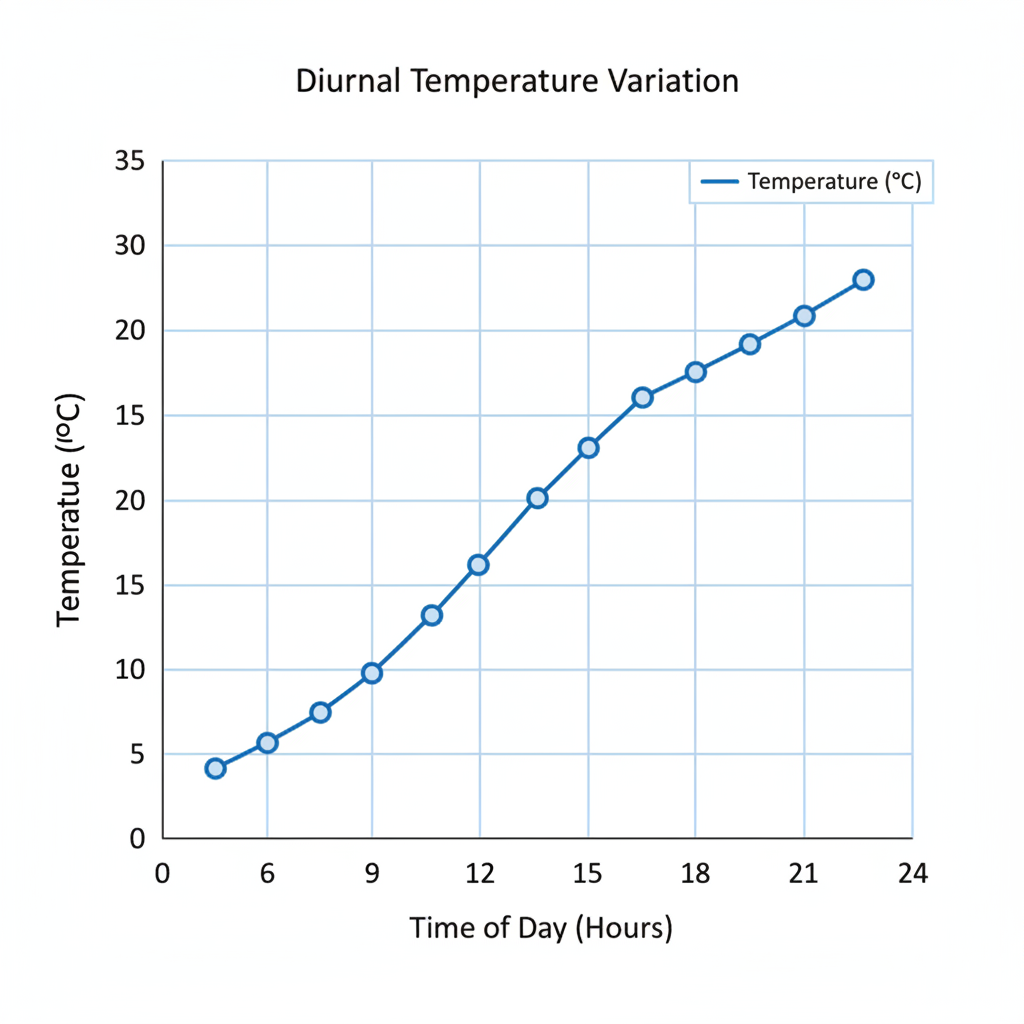
Line graphs are super useful for spotting trends. A trend is a general direction that something is going, like getting warmer or colder.
4. Pie Charts: A Slice of the Whole!
A pie chart looks like a circle cut into slices, like a pizza! It's used to show how different parts make up a whole. Each slice represents a portion of the total.
Example: Types of Fruit in a Basket
- Apples: 4
- Bananas: 3
- Oranges: 5
- Grapes: 2 bunches
If we made a pie chart, the whole pie would be all the fruit. A big slice might be oranges (since there are 5), a smaller slice might be grapes (2 bunches), and so on. The size of each slice shows its proportion compared to all the other fruits.
Analogy: Imagine a pizza. If you're sharing it with friends, each person gets a slice. The size of your slice depends on how many people are sharing and how big each person's portion is. A pie chart shows how the "whole pizza" (all the data) is divided into "slices" (different categories).
Why is Reading Data Important?
Being able to read and interpret data is like having a superpower! It helps us:
- Make Smart Decisions: If a bar graph shows that most students prefer recess over homework, the school might decide to schedule more outdoor activities.
- Understand the World Around Us: News reports often use graphs to show things like how many people are doing a certain job or how the economy is doing.
- Solve Problems: Scientists use data to understand diseases and find cures. Meteorologists use data to predict the weather.
- Spot Patterns and Trends: Like seeing that ice cream sales always go up in the summer!
So, the next time you see a chart or a graph, don't be intimidated! Remember our detective tools and analogies. Look at the labels, look at the bars or lines or slices, and ask yourself: "What story is this data telling me?" With practice, you'll become a data-reading superstar!
Keep learning, free
Create a free Syllabax account to unlock practice questions and games for this topic.
Visual Learning Enhanced! 🚀
To help you master this topic, we use Advanced Syllabax AI to generate detailed diagrams and visual models.
Note on Visuals: The AI sometimes makes spelling errors in image labels. Please refer to the lesson text for the correct terminology.