Learning Journey
Watch this topic in 60 seconds
Free preview · Lesson 1
Understanding Introduction to Bar Graphs
Welcome to the World of Bar Graphs! 📊
Hello, amazing second graders! Are you ready to learn a super cool way to show information and compare things? Imagine you have a bunch of your favorite toys, and you want to know which one you have the most of, or which color crayon your class likes best. How can you show this so everyone can see it quickly and easily? That's where bar graphs come in!
What is a Bar Graph? Think of it like a Block Tower! 🏗️
A bar graph is like a special picture that uses tall, colorful bars (just like big blocks or towers!) to show how much or how many of something there is. Instead of just reading a list of numbers, a bar graph helps us see the numbers, making it super easy to compare things. It's like building towers with LEGOs to show how many red blocks you have versus blue blocks!
Imagine you have 5 red blocks and 3 blue blocks. On a bar graph, the 'red' tower would be 5 blocks tall, and the 'blue' tower would be 3 blocks tall. Instantly, you can see that the red tower is taller, meaning you have more red blocks!
Why Do We Use Bar Graphs? To See Stories in Pictures! 🖼️
We use bar graphs because they are fantastic storytellers! They tell us stories about data (that's just fancy word for information or numbers) in a way that our eyes can understand very quickly. It's much faster to look at a bar graph to see which ice cream flavor is most popular than to read a long list of people's choices. Bar graphs help us:
- Compare things easily: Which pet is liked the most? Which fruit is eaten the least?
- See patterns: Are more people choosing one thing over another?
- Answer questions quickly: How many more people like soccer than basketball?
Think of it as a competition between different things, and the bar graph shows us who's winning (the tallest bar!) or who needs more votes (the shortest bar!).
The Secret Parts of a Bar Graph: Like Pieces of a Puzzle! 🧩
Every good bar graph has important parts that help us understand the story it's telling. Let's look at each puzzle piece:
1. The Title: The Name of the Story! 📝
Just like a book has a title to tell you what it's about (like 'The Little Bear'), a bar graph has a title. The title tells you what information the graph is showing. For example, it might say 'Our Class's Favorite Fruits' or 'Number of Sunny Days This Month'. It's always at the top!
2. Labels: What Each Bar Stands For! 🏷️
Below or next to each bar, there are labels. These labels tell you what each bar is representing. If your graph is about favorite fruits, the labels might say 'Apple', 'Banana', 'Orange', and 'Grape'. These are like the names of each tower you're building!
3. The Bars: The Tall Towers! 🗼
These are the colorful, rectangular 'towers' themselves! Each bar shows the amount for its label. The longer or taller the bar, the more of that thing there is. If the 'Banana' bar is very tall, it means many people like bananas! If the 'Orange' bar is short, it means fewer people like oranges. The bars can go up and down (vertical) or side to side (horizontal).
Look at this picture! You can see the title, the labels for each bar, and the colorful bars themselves!
4. The Numbers (or Scale): The Counting Ladder! 📏
On the side of the graph (usually the left side if the bars go up and down), there's a line with numbers. This is like a special counting ladder! It tells us how many each height of the bar represents. It usually starts at zero and goes up by ones, twos, or fives. When you look at a bar, you trace your finger across to this number line to see exactly how many it shows.
How to Read a Bar Graph: Let's Uncover the Story! 🕵️♀️
Reading a bar graph is like being a detective! Here's how you can do it:
- Look at the Title First: What is this graph telling us about?
- Look at the Labels: What are the different things being compared? (e.g., different animals, different games).
- Look at the Numbers (Scale): How are we counting? By 1s, 2s, 5s?
- Look at Each Bar: Find the bar you're interested in.
- Read the Height of the Bar: Follow the top of the bar across to the numbers line to see how many it represents. That's the count for that item!
- Compare the Bars: Which bar is the tallest? That means the most! Which is the shortest? That means the least!
Let's try an example! Imagine a bar graph showing 'Favorite Pets'.
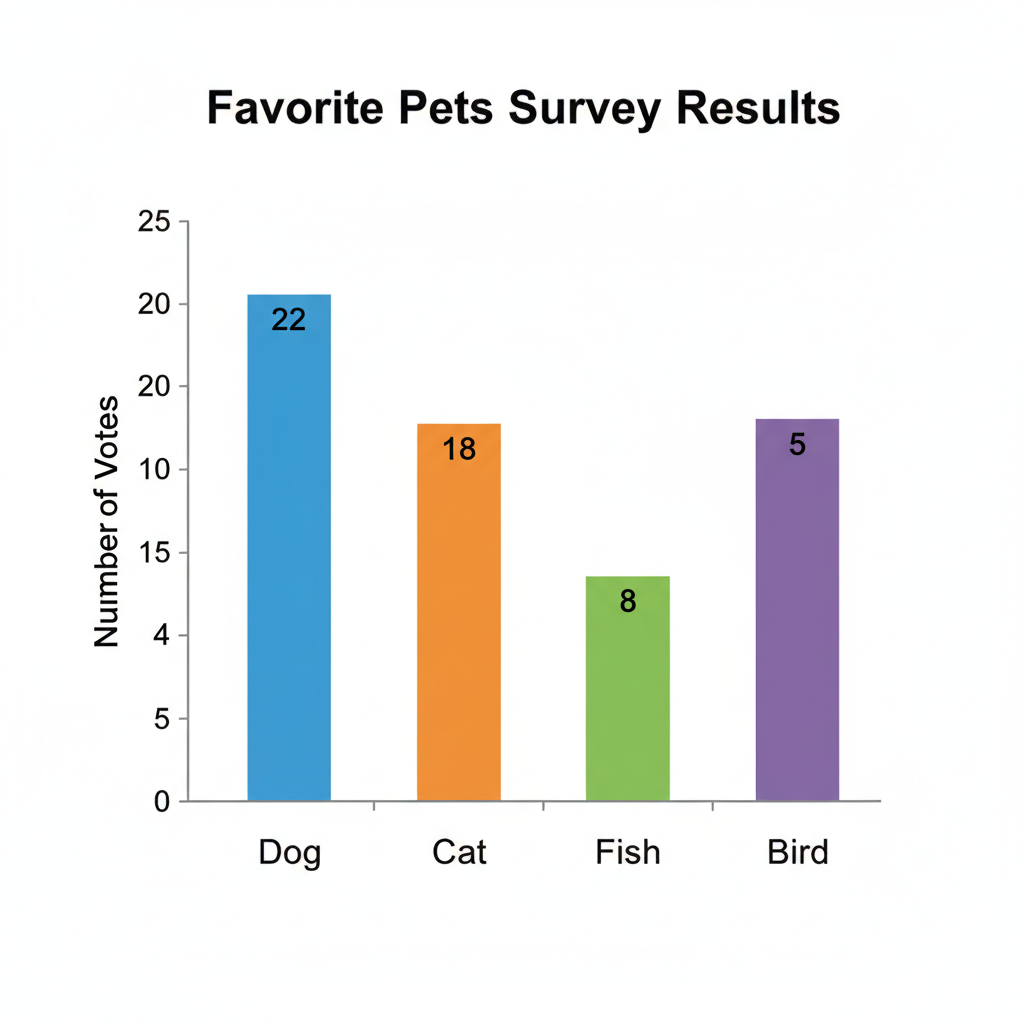
This graph shows different pets and how many students like each one.
If the bar for 'Dog' goes up to 8 on the number line, it means 8 students like dogs. If the bar for 'Cat' goes up to 6, then 6 students like cats. Which pet is liked the most? Dogs, because their bar is tallest!
Practice Makes Perfect! 🎉
You've just learned all about bar graphs! They are amazing tools for seeing information clearly and comparing things. Keep practicing, and you'll be a bar graph expert in no time. Remember, each bar tells a little story about 'how many'!
Great job, future data scientists!
Keep learning, free
Create a free Syllabax account to unlock practice questions and games for this topic.
Visual Learning Enhanced! 🚀
To help you master this topic, we use Advanced Syllabax AI to generate detailed diagrams and visual models.
Note on Visuals: The AI sometimes makes spelling errors in image labels. Please refer to the lesson text for the correct terminology.