Project: Daily Weather Data
Watch this topic in 60 seconds
Free preview · Lesson 1
Understanding Project: Daily Weather Data
Project: Becoming a Daily Weather Detective!
Hey there, young scientists! Have you ever wondered why some days are sunny and warm, while others are rainy and chilly? Or why the wind sometimes whispers and other times howls? That's all about weather! Weather is what's happening outside right now, in a specific place.
What is Weather Data?
Imagine you're trying to tell a story about the sky and air around us. To tell a good story, you need facts and details, right? Weather data is just like those facts and details for the weather story! It's information we collect about different parts of the weather.
Think of it like keeping a diary for the sky. Every day, you write down what the sky is doing. Over time, your weather diary will show amazing patterns!
The Main Characters in Our Weather Story
To be a great weather detective, you need to know what to look for. Here are the main things we'll track:
1. Temperature: How Hot or Cold It Feels
Temperature tells us how much 'heat energy' is in the air. When it's hot, there's lots of heat energy, like a warm blanket. When it's cold, there's not much, like an empty fridge.
- Simple Definition: How warm or cool the air is.
- Analogy: Think of an oven and a freezer. The oven has high 'temperature,' and the freezer has low 'temperature.'
- How we measure it: We use a thermometer. It's a tool with a red or silver line that moves up when it's hotter and down when it's colder.
2. Precipitation: What Falls from the Sky
Precipitation is any kind of water that falls from the clouds to the ground. It can be wet, icy, or even fluffy!
- Simple Definition: Water falling from the atmosphere to the Earth's surface.
- Analogy: Imagine the sky is like a giant watering can, and sometimes it sprinkles water (rain), or snows out tiny ice crystals (snow), or even drops little ice balls (hail)!
- Examples: Rain, snow, sleet, hail.
- How we measure it: We use a rain gauge. It's like a special cup with markings that show how much rain has fallen. For snow, you can measure its depth with a ruler!
3. Wind: Air on the Move!
Wind is just moving air. We can't see air, but we can feel the wind and see what it does, like rustling leaves or blowing hair.
- Wind Speed (How Fast):
- Simple Definition: How quickly the air is moving.
- Analogy: Think about blowing a feather. A gentle puff is slow wind, a strong huff is fast wind!
- How we measure it: A fancy tool called an anemometer (pronounced: an-uh-MOM-uh-ter) measures wind speed. It usually has little cups that spin around. You can also estimate by looking at trees or flags.
- Wind Direction (Where It's Coming From):
- Simple Definition: The direction from which the wind is blowing. If the wind is blowing from the West, it's a 'Westerly' wind.
- Analogy: If you point your finger into the wind, that's the direction it's coming from. It's like a giant invisible hand pushing the air!
- How we measure it: A wind vane (often shaped like a rooster on top of a building) or a wind sock (like a fabric cone at an airport) points in the direction the wind is blowing from.
4. Cloud Cover: How Much Sky is Hidden?
Clouds are made of tiny water droplets or ice crystals floating in the air. They can cover part of the sky, or all of it!
- Simple Definition: How much of the sky is covered by clouds.
- Analogy: Imagine the sky is like a giant blue canvas. Clouds are like fluffy white or gray blankets that sometimes cover parts of the canvas, or even the whole thing!
- How we observe it: This is mostly done by looking up! You can estimate if the sky is 'clear' (no clouds), 'partly cloudy' (some clouds), 'mostly cloudy' (lots of clouds), or 'overcast' (completely covered).
Your Daily Weather Detective Project!
Now, let's put on our detective hats and start collecting our own daily weather data!
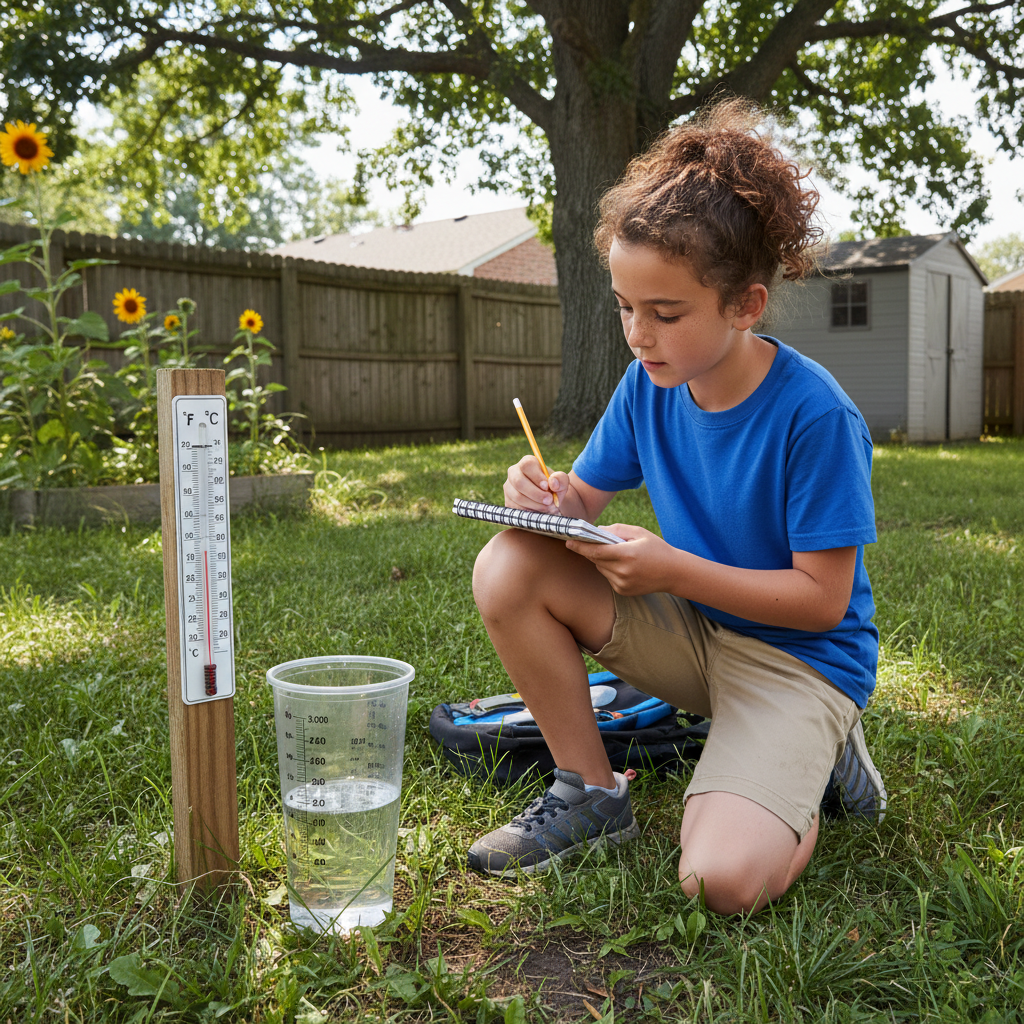 ⚠️ This picture may have spelling mistakes. Trust the words in the lesson.
What You'll Need:
- A Thermometer: To measure temperature. (You might have one outside a window!)
- A Rain Gauge (or a straight-sided jar/can with a ruler): To measure precipitation.
- A Wind Vane or Wind Sock (or just observe a flag/leaves): To find wind direction.
- A Notebook and Pen/Pencil: For your weather diary!
- A Regular Time: Choose the same time each day (like after school) to make your observations. This helps make your data fair and accurate!
How to Collect Your Data:
- Find a Good Spot: Choose a safe, open outdoor area where your tools won't be blocked by buildings or trees too much.
- Set Up Your Tools: Place your thermometer in a shady spot (direct sun will give you a fake high temperature!). Place your rain gauge in an open spot away from trees or overhangs.
- Observe and Record: Every day at your chosen time:
- Read the thermometer for the temperature.
- Check your rain gauge for any precipitation. If there was rain, record the amount and then empty the gauge.
- Look at a flag, leaves, or your wind vane to see the wind direction.
- Notice if the wind is gentle or strong for wind speed (you can use words like 'calm,' 'breezy,' 'windy').
- Look up at the sky and decide the cloud cover (clear, partly cloudy, mostly cloudy, overcast).
- Write everything down neatly in your notebook!
Why is This Project Important?
Collecting daily weather data might seem simple, but it's super powerful! Here's why:
- Spotting Patterns: After a week or two, you'll start to see patterns! Do warm days usually come after sunny days? Does the wind always blow from the same direction before it rains?
- Making Predictions: When you understand patterns, you can start to make guesses (predictions) about what the weather might do next! Just like a detective uses clues to solve a mystery.
- Understanding Your Local Climate: Over a longer time (like a month or a season), your data helps you understand the typical weather for where you live. This is called climate. Climate is like the weather's personality over a long time, while weather is its mood right now.
So, get ready to explore the amazing world of weather right outside your door! You're not just writing down numbers; you're becoming a real scientist, observing and understanding the world around you.
Keep learning, free
Create a free Syllabax account to unlock practice questions and games for this topic.
Visual Learning Enhanced! 🚀
To help you master this topic, we use Advanced Syllabax AI to generate detailed diagrams and visual models.
Note on Visuals: The AI sometimes makes spelling errors in image labels. Please refer to the lesson text for the correct terminology.