Learning Journey
Watch this topic in 60 seconds
Free preview · Lesson 1
Understanding Reading Picture Graphs
Decoding the Story: Your Guide to Reading Picture Graphs! (Grade 5)
Hey there, young data detectives! Have you ever seen a drawing that tells a story, not with words, but with pictures and symbols? Well, that's exactly what a picture graph does! It's a super fun way to show information and compare different things, all without a lot of confusing numbers.
What's a Graph Anyway? (It's Like a Storyteller!)
Imagine you want to tell your friends how many blue, red, and yellow LEGO bricks you have. You could just say, "I have 10 blue, 5 red, and 7 yellow." But what if you could SHOW them in a way that's easy to see and understand quickly? That's where graphs come in! A graph is like a special kind of drawing that organizes information so we can understand it at a glance. It helps us see patterns, compare things, and answer questions without having to read long lists.
Think of it like a visual storyteller. Instead of reading a book, you're looking at a colorful drawing that instantly gives you the main idea.
Introducing the Picture Graph: Pictures That Count!
A Picture Graph (sometimes called a pictograph) is a type of graph that uses pictures or symbols to represent data. Instead of bars or lines, you'll see a row of little pictures. Each picture stands for a certain number of items.
It's like when you see emojis on your phone – one little face can tell a whole story or feeling without using any words. In a picture graph, one little picture tells you about a certain number of things!
The Super Important Parts of a Picture Graph
Just like a good story has characters, a setting, and a plot, a picture graph has different parts that help us understand the information. Let's explore them:
-
The Title: What's the Story About?
Every good story needs a title, right? The Title of a picture graph tells you what kind of information the graph is showing. It's usually at the very top. For example, a title might be "Our Class's Favorite Fruits" or "Number of Books Read This Month." The title is like the headline of a newspaper – it gives you the big idea right away!
-
Categories/Labels: Who or What Are We Counting?
These are the different groups of things being counted or compared. If the graph is about "Our Class's Favorite Fruits," the categories might be "Apples," "Bananas," "Oranges," and "Grapes." These are usually listed down the side or across the bottom of the graph. Think of them as the 'chapters' of your data story.
-
Pictures/Symbols: The Little Storytellers
These are the actual drawings or icons used to represent the data. If you're counting apples, you might see apple pictures. If you're counting cars, you might see car pictures. Each picture helps you count how many items are in each category.
-
The KEY (or Legend): The Secret Code Breaker!
This is arguably the MOST important part of a picture graph, and it's where many people make mistakes if they don't pay close attention! The Key tells you what each picture or symbol stands for. It's usually in a small box at the bottom or side of the graph.
- Analogy 1: The Secret Decoder Ring! Imagine you have a secret message, and without your decoder ring, it's just gibberish. The key is like that decoder ring! It tells you that one picture doesn't always mean '1' item. It might mean '2' items, or '5' items, or even '10' items! You MUST check the key every single time.
- Analogy 2: Money Exchange Rate! If you're exchanging dollar bills for quarters, you know one dollar bill is worth four quarters. The key is like knowing that exchange rate. One 'star' picture might be 'worth' 5 points, not just 1.
- Analogy 3: Super Symbols! Sometimes, a single symbol is a 'super symbol' that represents a whole bunch of things. Like one big box of crayons might contain 64 crayons. The key tells you how 'super' each symbol is!
If the key says " = 2 students," then every happy face picture you see on the graph counts as two students, not just one!
How to Be a Picture Graph Pro: Step-by-Step!
Ready to read your first picture graph? Follow these simple steps:
- Step 1: Read the Title! What's the graph about? Get the main idea.
- Step 2: Look at the Categories! What different groups of things are being compared?
- Step 3: Find the Key! (THIS IS CRUCIAL!) What does each picture or symbol stand for? Don't skip this step! This is your secret code breaker.
- Step 4: Count Carefully! For each category, count the pictures. Remember to multiply by what the key says! If the key says each picture is 5, and you see 3 pictures, then it's 3 x 5 = 15.
- Step 5: Answer the Questions! Now that you know the numbers, you can easily answer questions like "Which category has the most?" or "How many more are in this group than that group?"
Let's Practice with an Example!
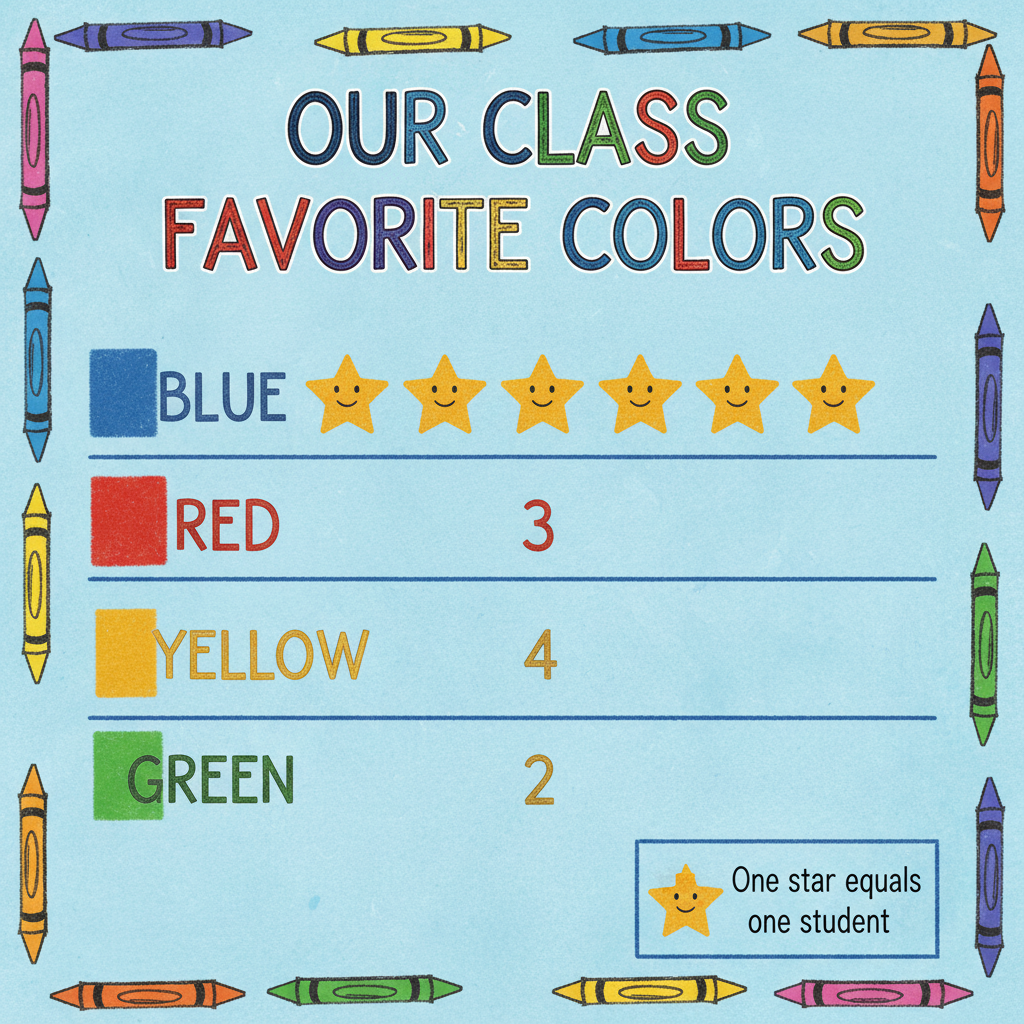
Here's a simple picture graph. Imagine your class took a vote on their favorite colors:
Our Class's Favorite Colors
Let's use our steps:
- Title: "Our Class's Favorite Colors."
- Categories: Blue, Red, Yellow, Green.
- Key: Each (star) = 1 student. This is easy, each star counts as one!
Now, let's count:
- Blue: 5 stars = 5 students
- Red: 3 stars = 3 students
- Yellow: 4 stars = 4 students
- Green: 2 stars = 2 students
Great! Now you can answer questions like: "Which color is most popular?" (Blue) or "How many students chose Red or Green?" (3 + 2 = 5 students).
Another Example: The Key Gets Tricky!
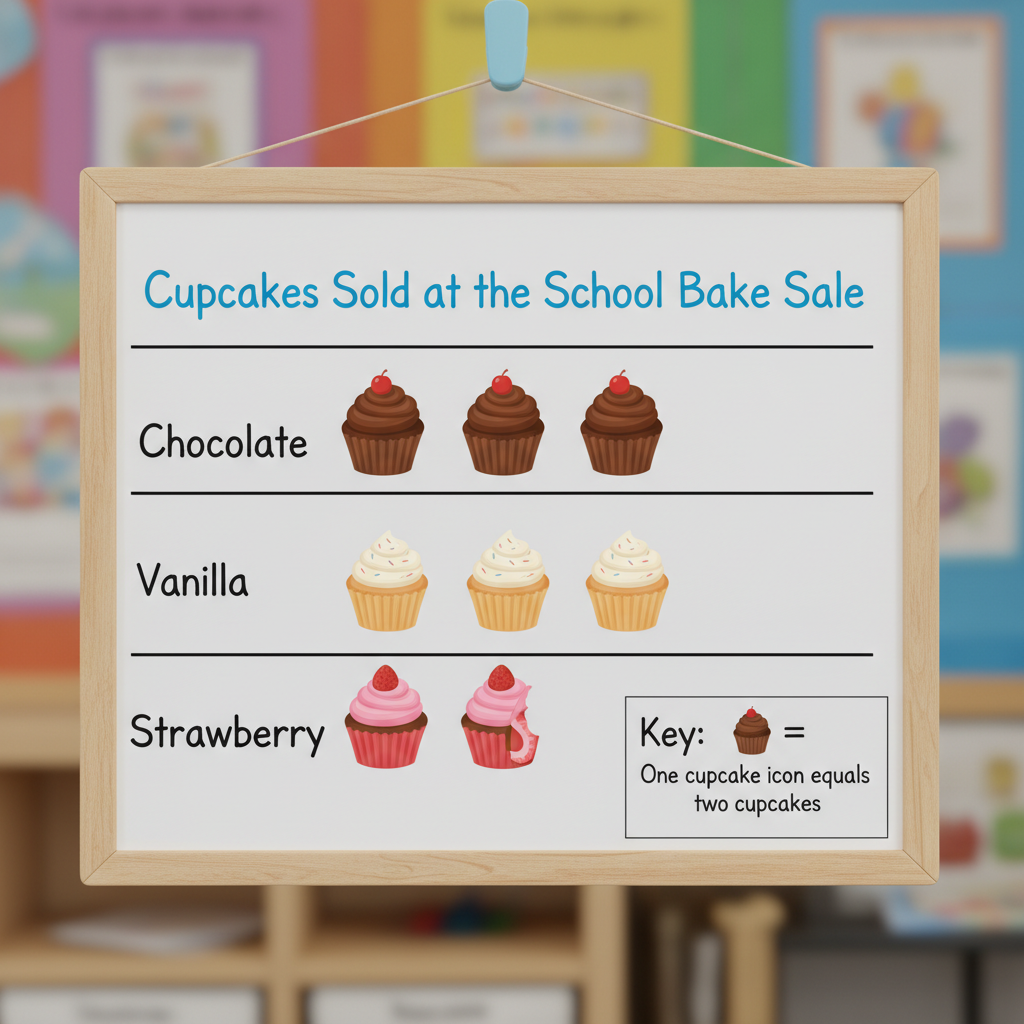
Now, let's try one where the key is a little different. Imagine you're counting the number of cupcakes sold at a bake sale:
Cupcakes Sold at the School Bake Sale
Let's use our steps again:
- Title: "Cupcakes Sold at the School Bake Sale."
- Categories: Chocolate, Vanilla, Strawberry.
- Key: Each
 ⚠️ This picture may have spelling mistakes. Trust the words in the lesson. (cupcake picture) = 2 cupcakes. Aha! This is important!
Now, let's count carefully:
- Chocolate: There are 4 cupcake pictures. Since each picture means 2 cupcakes, that's 4 x 2 = 8 cupcakes.
- Vanilla: There are 3 cupcake pictures. So, 3 x 2 = 6 cupcakes.
- Strawberry: There are 2 and a HALF cupcake pictures. So, 2 x 2 = 4, and a half picture means half of the key's value, which is half of 2, so 1. Total: 4 + 1 = 5 cupcakes.
See how important the key is? If you just counted the pictures, you'd get the wrong answer! You'd think 2.5 pictures meant 2.5 cupcakes, but it actually means 5 cupcakes!
Tips for Success!
- Always, always, ALWAYS find the key first! It's your map to understanding the whole graph.
- Count carefully. Sometimes a half-picture means half of the key's value.
- Use tally marks or write down numbers next to each category if it helps you keep track.
- Ask yourself questions about the graph after you've counted everything. What's the biggest? What's the smallest? How many more? How many in total?
You're now ready to be a picture graph expert! Keep practicing, and you'll be telling stories with data in no time!
Keep learning, free
Create a free Syllabax account to unlock practice questions and games for this topic.
Visual Learning Enhanced! 🚀
To help you master this topic, we use Advanced Syllabax AI to generate detailed diagrams and visual models.
Note on Visuals: The AI sometimes makes spelling errors in image labels. Please refer to the lesson text for the correct terminology.