Measures of Center: Median
Watch this topic in 60 seconds
Free preview · Lesson 1
Understanding Measures of Center: Median
Measures of Center: Median (Grade 8, Foundational)Unlocking the Middle: Understanding the Median
Welcome, 8th graders! Have you ever wondered what the 'typical' value is in a group of numbers? When you hear someone talk about the 'average' salary or the 'most common' shoe size, they're referring to something called a measure of center. Measures of center are like different ways to find the 'heart' or 'middle ground' of a set of data.
There are three main measures of center we talk about: the Mean, the Median, and the Mode. Think of them as three different detectives trying to find the 'center' of a mystery, each using their own special methods. Today, we're going to become experts in one of the most important detectives: the Median!
What is the Median? The True Middle Ground
Imagine you and all your friends line up from shortest to tallest. The person standing exactly in the middle of that line – that's the median! In mathematics, the Median is simply the middle value in a set of numbers that has been arranged in order from smallest to largest (or largest to smallest).
Analogy Time! Think of the median as the referee standing in the very middle of a tug-of-war game. No matter how many players are on each side, the referee is always positioned right in the heart of the action, with an equal number of players to their left and right.
Unlike the 'mean' (which is what most people think of as the 'average' and involves adding everything up and dividing), the median doesn't care about the exact values of all the numbers, only where they stand in line when ordered.
How to Find the Median: Step-by-Step Guide
Finding the median is a straightforward process, but it has a tiny twist depending on whether you have an odd or even number of data points. Let's break it down.
Scenario 1: You have an ODD number of data points
This is the easiest scenario! When you have an odd number of values, there will always be one clear number right in the middle.
- Step 1: Order Your Data! This is the absolute most crucial step. You MUST arrange your numbers from smallest to largest (ascending order) or largest to smallest (descending order). It doesn't matter which, as long as they are ordered consistently.
- Step 2: Find the Middle Number. Once your data is ordered, simply count in from both ends until you reach the single number left in the middle. That's your median!
Example 1: Finding Median (Odd Number of Data Points)
Let's say a group of 7 friends got the following scores on a quiz: 10, 7, 9, 10, 6, 8, 10. What is the median score?
- Order the Data: Arrange the scores from smallest to largest:
- 6, 7, 8, 9, 10, 10, 10
- Find the Middle Number: Count in from both ends:
6,7,8, 9,10,10,10- If you remove one from each side (6 and 10, then 7 and 10, then 8 and 10), you are left with 9.
So, the median quiz score is 9.
Analogy Time! Imagine 7 students lined up by height. The 4th student in line (from either end) is the one in the middle, with 3 students shorter than them and 3 students taller than them. Their height would be the median height for that group.
Scenario 2: You have an EVEN number of data points
This is where the tiny twist comes in! If you have an even number of data points, there won't be one single number exactly in the middle. Instead, you'll have two numbers sharing the middle spot.
- Step 1: Order Your Data! Just like before, arrange all your numbers from smallest to largest.
- Step 2: Find the Two Middle Numbers. Since there's an even count, you'll have two numbers left in the middle after you 'cross off' numbers from both ends.
- Step 3: Calculate the Average (Mean) of the Two Middle Numbers. To find the true median, you take those two middle numbers, add them together, and then divide by 2. This gives you the value exactly halfway between them.
Example 2: Finding Median (Even Number of Data Points)
Imagine 8 students reported the number of books they read last month: 5, 2, 8, 4, 10, 3, 7, 6. What is the median number of books read?
- Order the Data: Arrange the numbers from smallest to largest:
- 2, 3, 4, 5, 6, 7, 8, 10
- Find the Two Middle Numbers: Count in from both ends:
2,3,4, 5, 6,7,8,10- After crossing off numbers, you are left with 5 and 6 in the middle.
- Calculate the Average of the Two Middle Numbers:
- (5 + 6) / 2 = 11 / 2 = 5.5
So, the median number of books read is 5.5.
Analogy Time! If 8 friends line up by height, there isn't one person in the middle. Instead, the 4th and 5th people are the 'middle pair'. To find the median height, you'd find the exact height halfway between the 4th person's height and the 5th person's height.
Why is the Median So Useful? It Ignores the Extremes!
The median has a superpower that the mean doesn't always have: it's not easily affected by really big or really small numbers, called outliers. Outliers are data points that are much, much higher or lower than most of the other data points.
Let's look at an example:
Imagine 5 small businesses in a town. Their annual profits (in thousands of dollars) are:
- Mean (Average) Profit: (20 + 25 + 30 + 35 + 200) / 5 = 310 / 5 = $62 thousand.
- Median Profit: First, order the data: 20, 25, 30, 35, 200. The middle number is $30 thousand.
Notice how the mean profit of
Analogy Time! Think about the median as a judge who only cares about who's in the middle, not how rich or poor the people on the ends of the line are. If a billionaire suddenly joins a line of average-income people, the middle person's income won't change at all, even though the 'average' (mean) income of the group would skyrocket!
This makes the median extremely valuable when you're dealing with data that might have some extreme values, like incomes, house prices, or test scores where a few students did exceptionally well or poorly.
When to Use the Median
You'll often see the median used in these situations:
- Income and Wealth Data: Because a few very wealthy people can drastically skew the mean, the median income or median household wealth gives a more realistic picture of what a typical person or family earns.
- Housing Prices: The median house price in a city is usually reported because a few luxury mansions wouldn't accurately represent the price of a typical home.
- Any data with outliers: If your data has some numbers that are much bigger or smaller than the rest, the median is often the better measure of center to use.
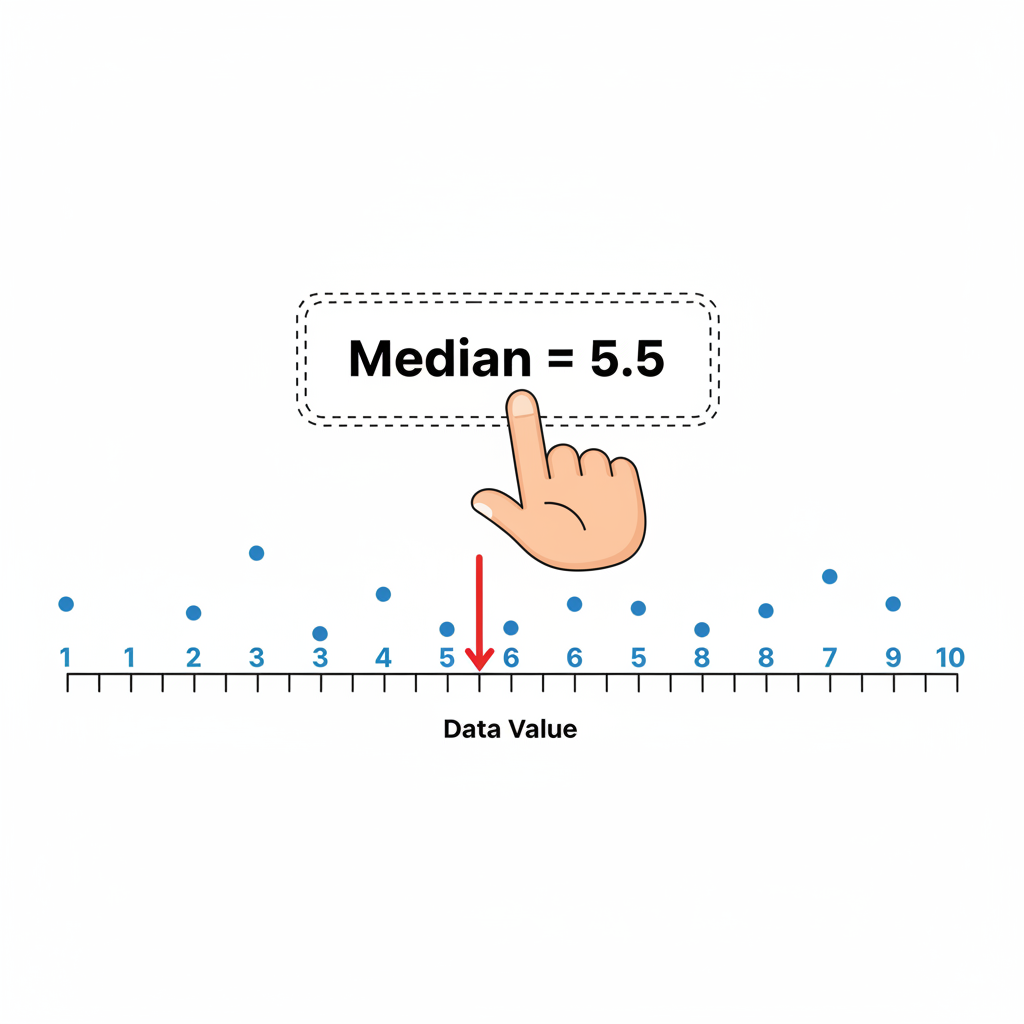 This image visually represents how the median is found in a sorted dataset, focusing on the central value.
Putting It All Together: Key Steps to Remember
To summarize, becoming a median master means remembering these core ideas:
- Always Order Your Data First! (Smallest to largest or largest to smallest).
- If there's an odd number of data points, the median is the single number right in the middle.
- If there's an even number of data points, the median is the average (mean) of the two numbers in the middle.
- The median is a great choice when your data has extreme values (outliers) because it isn't easily swayed by them.
You've now learned a powerful tool for understanding data. Keep practicing, and you'll be a pro at finding the true middle ground in any set of numbers!
Keep learning, free
Create a free Syllabax account to unlock practice questions and games for this topic.
Visual Learning Enhanced! 🚀
To help you master this topic, we use Advanced Syllabax AI to generate detailed diagrams and visual models.
Note on Visuals: The AI sometimes makes spelling errors in image labels. Please refer to the lesson text for the correct terminology.