Comparing Bar Graph Data
Watch this topic in 60 seconds
Free preview · Lesson 1
Understanding Comparing Bar Graph Data
Comparing Bar Graph Data: Let's Find Out Who Has More!
Imagine you want to know who has more cookies, you or your friend. Or which toy car is longer. We often compare things to see which is bigger, smaller, or if they are the same! In math, we use something called a "bar graph" to help us compare numbers easily, just like we compare heights of friends or towers built with blocks!
What is a Bar Graph?
A bar graph is like a special picture made of tall (or short) towers, called "bars," that show us how many of something there are. Each bar stands for a different thing, and its height tells us its number or amount.
- Analogy: Think of building LEGO towers! A very tall LEGO tower means you used many LEGO blocks. A short LEGO tower means you only used a few. A bar graph uses these "towers" to show numbers for different things!
The Important Parts of a Bar Graph:
Every bar graph has special parts that help us understand it:
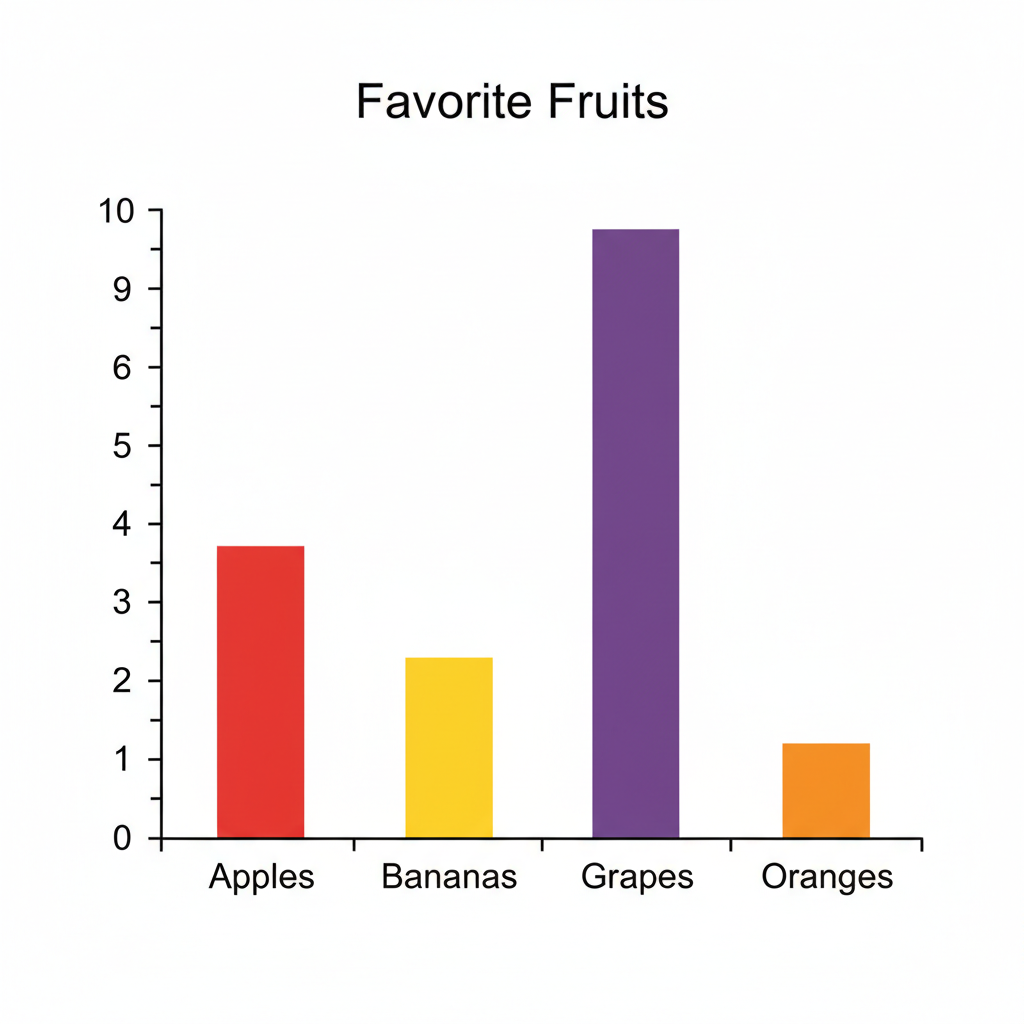
- Title: This is like the name of a book! It tells us what the whole graph is about. For example, "Our Favorite Fruits."
- Labels: These are the names of the things we are counting or comparing. If our graph is about favorite fruits, the labels might be "Apples," "Bananas," and "Grapes."
- Numbers (or Scale): These are the numbers usually found up the side or along the bottom of the graph. They act like a ruler and help us know exactly how many each bar stands for. If a bar goes up to the number 5, it means there are 5 of that thing.
- Bars: These are the colorful "towers" themselves! The end of each bar points to a number on the scale, telling us its amount.
Reading a Bar Graph: Finding "How Many"?
To find out how many of one particular thing there are, you simply look at its bar. Follow the top of that bar straight across to the numbers (the scale) and see which number it lines up with. That's how many!
- Analogy: If you want to know how many cookies John has, you find John's cookie tower (bar), and then look across to the number ruler to see how tall it is. If it reaches the number 6, John has 6 cookies!
Comparing Bar Graphs: Who Has More? Who Has Less?
This is the super fun part! We use bar graphs to compare numbers without even doing a lot of counting!
1. Finding "Which has MORE?"
Look for the tallest bar! The tallest bar always shows the biggest number, meaning it has the most of whatever you are counting.
- Analogy: If you and your friend stand next to each other, the taller friend has more height! In a bar graph, the tallest bar has more "stuff" (like more votes, more toys, more anything!).
2. Finding "Which has LESS?"
Look for the shortest bar! The shortest bar always shows the smallest number, meaning it has the least of whatever you are counting.
- Analogy: The shorter friend has less height. The shortest bar in a graph has less "stuff."
3. Finding "Are they the SAME?"
If two bars are exactly the same height, it means they have the same number or amount!
Comparing with Numbers: "How Many MORE?" or "How Many LESS?"
Sometimes we want to know *exactly* how many more one thing has than another. Or *exactly* how many less. To find this difference, we use subtraction!
- First, find the number for the taller bar.
- Next, find the number for the shorter bar.
- Then, subtract the smaller number from the bigger number. The answer tells you how many more or less!
- Analogy: If Sarah has 7 cookies and Tom has 5 cookies, Sarah has more. To find out *how many more*, you do 7 - 5 = 2. Sarah has 2 more cookies! It's the same with bars!
Finding the "TOTAL"
Sometimes a question might ask you, "How many in ALL?" or "What is the TOTAL?" This means you need to add the numbers from two or more bars together!
- Find the numbers for the bars you need to add together.
- Add those numbers. The answer is your total!
- Analogy: If you have 3 red cars and 4 blue cars, your total cars are 3 + 4 = 7 cars!
Let's Remember These Bar Graph Superpowers!
- Bar graphs make comparing numbers easy and fun!
- Tall bars mean more.
- Short bars mean less.
- Use subtraction to find "how many more" or "how many less."
- Use addition to find the "total" or "how many in all."
Keep learning, free
Create a free Syllabax account to unlock practice questions and games for this topic.
Visual Learning Enhanced! 🚀
To help you master this topic, we use Advanced Syllabax AI to generate detailed diagrams and visual models.
Note on Visuals: The AI sometimes makes spelling errors in image labels. Please refer to the lesson text for the correct terminology.