Graphing Class Birthdays
Watch this topic in 60 seconds
Free preview · Lesson 1
Understanding Graphing Class Birthdays
Let's Graph Our Class Birthdays! 🎉
Hi, wonderful second graders! Today, we're going on a super fun adventure. We're going to become birthday detectives and create a special picture that tells us all about our own class birthdays! It's going to be like magic, turning numbers into easy-to-see stories.
What in the World is a Graph? 🤔
Imagine you have a big secret, but instead of whispering it, you draw a picture that everyone can understand super quickly! That's kind of like a graph. A graph is a special kind of picture that shows us information, like numbers or how many of something there are, in a way that's easy to see and compare.
Think of it like a treasure map for information! Instead of an 'X' marking the spot for treasure, our graph will mark the spot for how many birthdays are in each month. It helps our eyes find the answers to questions super fast!
Why Do We Graph Birthdays? 🎂
Have you ever wondered which month has the most birthdays in our class? Or which month has the fewest? Maybe you want to find out if you share your birthday month with many friends, or if you're one of a kind!
Graphing our birthdays helps us answer these questions with just one quick look. It's like having super detective eyes for our classroom birthday facts! It makes looking at numbers exciting and colorful.
Getting Ready: Collecting Our Birthday Data! 🕵️♀️
Before we can draw our amazing birthday picture, we need to gather our information. This information is called 'data.'
Analogy: Collecting data is like gathering all the yummy ingredients before you bake a delicious cake. You can't bake without flour and eggs, right? Well, we can't make a graph without knowing everyone's birthday month!
Step 1: Ask and Listen!
We'll go around the room, and everyone will tell us their birthday month. It's important to listen carefully so we get it right!
Step 2: Make a Tally Chart!
A tally chart is a super handy way to count. For every birthday we hear in a month, we make one line (|). When we get to five, we draw a line across the first four (||||). This helps us count big numbers easily without losing track.
Example Tally Chart:
- January: ||
- February: |||
- March: |
- April: ||||
- May: ||||
|||| - June: |||
- And so on for all the months!
Building Our Graph: Bar Graphs and Pictographs! 🏗️
There are different ways to draw our 'information picture.' Today, we'll learn about two super popular and fun kinds: Bar Graphs and Pictographs.
A. The Bar Graph: Towers of Birthdays! 🗼
Imagine building towers with colorful blocks. That's what a bar graph looks like! Each 'tower' (or bar) shows us how many birthdays are in a specific month. The taller the tower, the more birthdays that month has!
Parts of a Bar Graph:
- Title: This tells us what the graph is all about. For us, it would be something like "Our Class Birthdays."
- Labels: These are the words that tell us what each part of the graph means. We'll have months like "January," "February," and numbers like "1, 2, 3" for how many students.
- Bars: These are the colorful rectangles that stretch up! The taller a bar is, the more birthdays are in that month.
- Scale: These are the numbers up the side that tell us how high to make our bars. It's usually like counting by 1s or 2s.
How to Build a Bar Graph (Step-by-Step):
- Draw the Lines: First, draw two lines, one going straight up (this is called the vertical axis) and one going straight across (this is called the horizontal axis), like the corner of a big square.
- Label the Bottom (Months!): Along the line going across, write the names of the months (Jan, Feb, Mar, etc.). These are like the foundations for your towers.
- Label the Side (Numbers!): Along the line going up, write numbers starting from 0, going up to the highest number of birthdays you counted. This is your "how many" scale.
- Draw Your Bars! Look at your tally chart. If January has 2 birthdays, you draw a colorful bar above "January" that goes up to the number 2 on your side scale. If July has 5 birthdays, its bar goes up to 5!
- Give it a Title! Don't forget to write "Our Class Birthdays" at the top so everyone knows what they are looking at!
Analogy: Think of a bar graph like a city skyline! Each building (bar) is a month, and its height tells you how many people live there (how many birthdays).
B. The Pictograph: Pictures Tell the Story! 🖼️
A pictograph is another super fun way to show information, but instead of bars, we use little pictures! It's like drawing stickers to tell our birthday story.
Key Idea: The Key! A pictograph always has a "key." The key tells us what each little picture stands for. For our birthday graph, one happy face sticker might mean "1 student's birthday." Or maybe one balloon 🎈 means "2 students' birthdays" if we have a very big class!
How to Build a Pictograph (Step-by-Step):
- Draw the Lines and Label: Just like with the bar graph, draw your lines and write the months along the bottom.
- Choose Your Picture: Decide what little picture you want to use (like a cake, a star, or a happy face).
- Make a Key! This is super important! Write something like: "Key: 🎂 = 1 Birthday." This tells everyone what your picture means.
- Draw Your Pictures! Now, for each month, draw the correct number of pictures. If February has 3 birthdays, you draw 3 little cakes above "February." If November has 1 birthday, you draw just one little cake!
- Give it a Title! "Our Class Birthdays Pictograph" works perfectly!
Analogy: A pictograph is like drawing stickers on a chart! Each sticker is a birthday, and the key tells you how many birthdays each sticker is worth. It's like a secret code, but you give everyone the answer key!
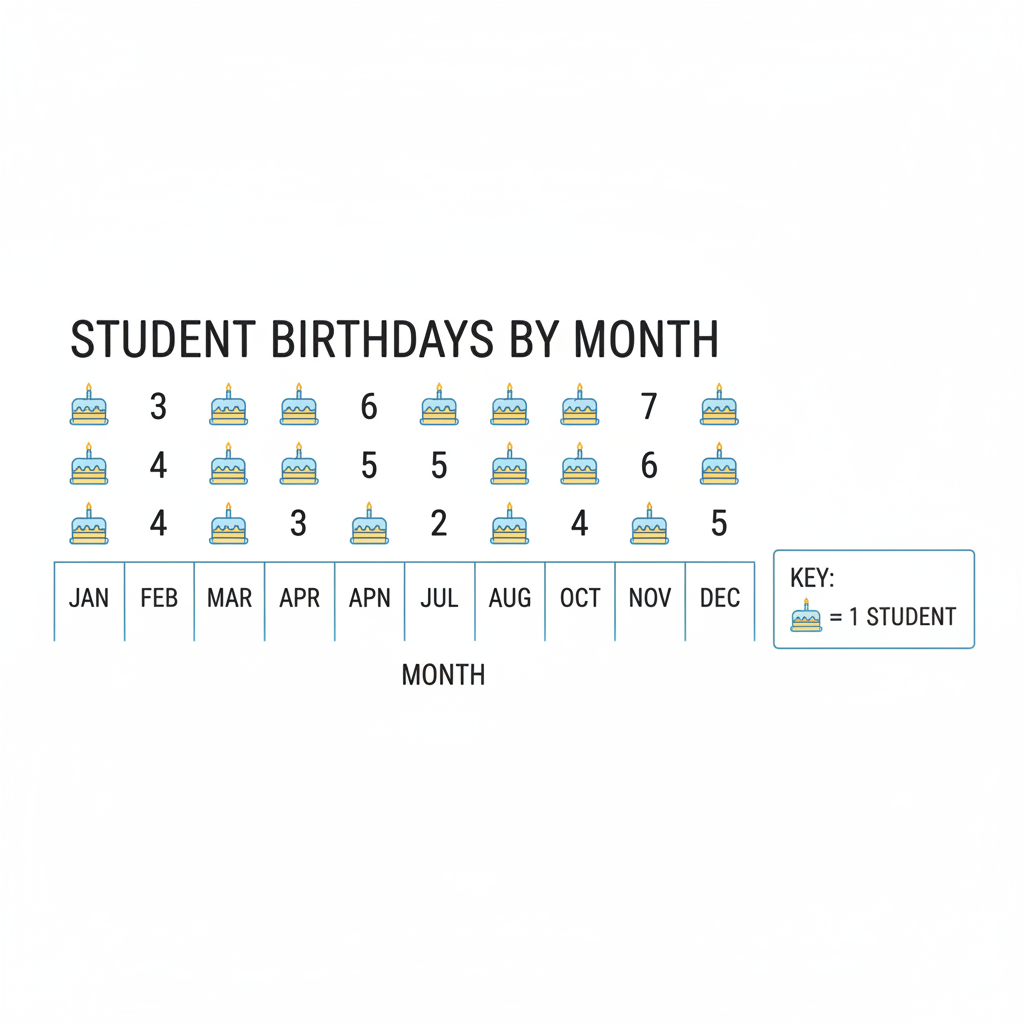 ⚠️ This picture may have spelling mistakes. Trust the words in the lesson.
Reading Our Graph: What Story Does It Tell? 📖
Once our graph is finished, it's like magic! We can learn so much just by looking at it:
- Which month has the MOST? Look for the tallest bar or the longest row of pictures.
- Which month has the FEWEST? Look for the shortest bar or the shortest row of pictures.
- Are there any months with NO birthdays? Some months might have no bars or no pictures!
- Are there any months with the SAME number of birthdays? Look for bars or rows of pictures that are the same height or length.
Analogy: Reading a graph is like being a detective! The graph gives you clues, and you use your eyes to solve the birthday mysteries of our class! You can ask questions and the graph will give you the answers quickly.
Time to Practice! 💪
Now you know all about how to make and read graphs. It's a super useful skill that will help you understand information in many other subjects too!
Remember, graphs help us see information clearly and quickly. They turn numbers into easy-to-understand, colorful pictures! Great job, birthday detectives!
Keep learning, free
Create a free Syllabax account to unlock practice questions and games for this topic.
Visual Learning Enhanced! 🚀
To help you master this topic, we use Advanced Syllabax AI to generate detailed diagrams and visual models.
Note on Visuals: The AI sometimes makes spelling errors in image labels. Please refer to the lesson text for the correct terminology.