Calculating the Range
Watch this topic in 60 seconds
Free preview · Lesson 1
Understanding Calculating the Range
Welcome to Understanding Data Spread: Calculating the Range!
Hello, future data wizards! Have you ever looked at a collection of numbers and wondered, 'How spread out are these numbers?' Maybe you've seen a list of test scores, heights of friends, or daily temperatures. All of these lists are what we call data. Understanding data isn't just for scientists or mathematicians; it helps us make sense of the world around us every single day!
What Does 'Spread Out' Even Mean?
Let's start with a simple idea. Imagine your family. You probably have people of different heights – maybe a younger sibling who is still growing and is quite short, and an older relative who is very tall. If you wanted to know the 'spread' of heights in your family, you might look at the difference between the tallest person and the shortest person. This difference gives you a quick idea of how varied, or 'spread out,' the heights are.
In mathematics, when we want to measure how 'spread out' a set of numbers is, one of the easiest and most foundational ways to do it is by calculating something called the Range.
Introducing the Range: Your First Tool for Data Spread
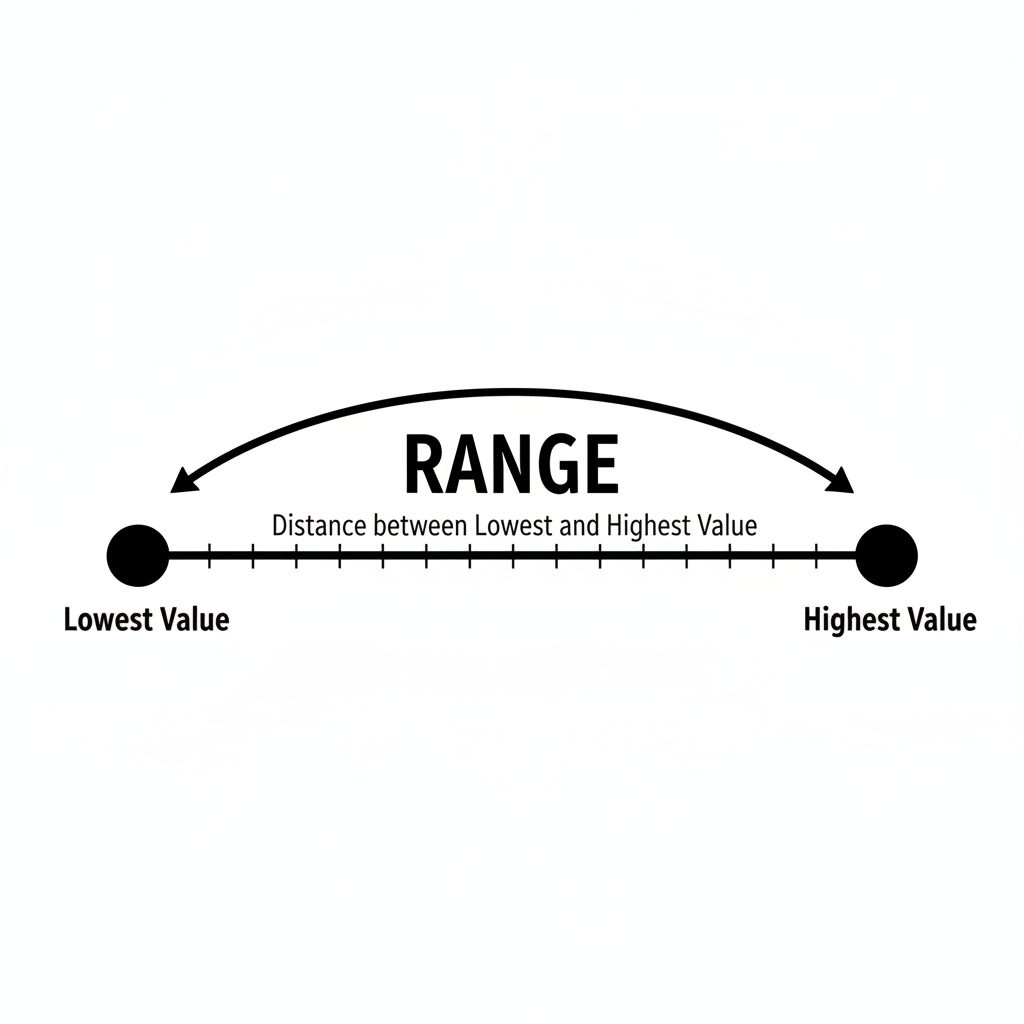
The **Range** is a very simple but powerful idea. It's like finding the two furthest points in your data set – the absolute biggest number and the absolute smallest number – and then figuring out how much space is between them. Think of it as measuring the distance from one end of your data to the other.
The Official Definition:
The **Range** is the **difference** between the **highest (largest) value** and the **lowest (smallest) value** in a set of data.
Let's use another analogy. Imagine you're tracking the temperature in your town. One day it might be 50 degrees Fahrenheit, and later that same day it might climb to 80 degrees Fahrenheit. The 'spread' or 'range' of temperatures for that day is 30 degrees (80 - 50). That's a pretty big temperature swing! If the next day the temperature only went from 65 to 70 degrees, the range would be much smaller (5 degrees), meaning less spread in temperature.
Your Step-by-Step Recipe to Calculate the Range!
Calculating the range is like following a simple cooking recipe. Just a few easy steps, and you'll have your answer!
-
Step 1: Gather Your Ingredients (Get Your Data Ready!)
First, make sure you have all your numbers written down. It often helps to list them out clearly, or even put them in order from smallest to largest, although it's not strictly necessary for the range (it just makes finding the highest and lowest easier!).
-
Step 2: Find the Biggest Ingredient (Identify the Highest Value!)
Look through all your numbers and find the one that is the largest. This is your 'maximum' value.
-
Step 3: Find the Smallest Ingredient (Identify the Lowest Value!)
Now, look through your numbers again and find the one that is the smallest. This is your 'minimum' value.
-
Step 4: Mix It Up (Do the Subtraction!)
Finally, subtract the smallest value (from Step 3) from the largest value (from Step 2). The answer you get is your **Range**!
The Formula:
Range = Highest Value - Lowest Value
Let's Practice with Some Examples!
Example 1: Your Quiz Scores
Imagine these are your scores on five recent math quizzes: 85, 92, 78, 95, 88.
- Step 1: Data: 85, 92, 78, 95, 88
- Step 2: Highest Value: Looking at the numbers, 95 is the biggest.
- Step 3: Lowest Value: Looking at the numbers, 78 is the smallest.
- Step 4: Subtract: Range = 95 - 78 = 17
So, the range of your quiz scores is 17 points. This tells you there was a 17-point difference between your best and worst score. That's a pretty good indicator of how consistent (or inconsistent) your scores were.
Think of it like the difference between the highest peak and the lowest valley on a mountain range. The range tells you how tall that mountain range is from its bottom-most point to its top-most point.
Example 2: Daily Visitors to a Park
A local park recorded the number of visitors each day for one week: 120, 155, 110, 180, 130, 145, 160.
- Step 1: Data: 120, 155, 110, 180, 130, 145, 160
- Step 2: Highest Value: The largest number of visitors was 180. (Looks like Thursday was a very popular day!)
- Step 3: Lowest Value: The smallest number of visitors was 110. (Tuesday seems to have been a bit quiet!)
- Step 4: Subtract: Range = 180 - 110 = 70
The range of visitors for the week was 70. This means there was a difference of 70 visitors between the busiest day and the least busy day at the park. This tells the park management how much visitor numbers can fluctuate from day to day.
Why Is the Range Useful? (It Gives Us a Quick Peek!)
The range is valuable because it:
- Gives a quick understanding: It's the simplest way to get an idea of how spread out numbers are. You don't need complicated math!
- Helps in comparisons: You can compare the range of different data sets. For instance, if one basketball team's scores have a range of 5 points in a tournament, and another team's scores have a range of 25 points, you know the first team is much more consistent in their scoring!
Imagine two baskets of apples. Basket A has apples weighing 100g, 105g, 110g, and 115g. Its range is 15g. Basket B has apples weighing 80g, 100g, 120g, and 140g. Its range is 60g. Just by looking at the range, you can immediately tell that the apples in Basket B have a much wider variety of weights – some are very light, and some are quite heavy, compared to Basket A where all the apples are pretty close in weight.
Limitations of the Range (What It DOESN'T Tell Us)
While super helpful, the range has its limits. It only uses the two extreme numbers (the highest and the lowest). It doesn't tell you anything about:
- What most of the numbers are doing (are they clustered in the middle?).
- If there are 'outliers' – numbers that are way bigger or smaller than almost all the other numbers, which can make the range seem much larger than it truly represents for the majority of the data.
For example, if your test scores were 50, 90, 92, 95, 98, the range would be 48 (98-50). This large range is mostly due to that one low score of 50. The other scores are very close together!
Conclusion: Master the Range!
The range is a fundamental concept in statistics that helps us understand the spread or variability of data. By simply identifying the biggest and smallest numbers and performing one subtraction, you gain valuable insight into your data set. Keep practicing these steps, and you'll be a pro at calculating the range in no time!
Keep learning, free
Create a free Syllabax account to unlock practice questions and games for this topic.
Visual Learning Enhanced! 🚀
To help you master this topic, we use Advanced Syllabax AI to generate detailed diagrams and visual models.
Note on Visuals: The AI sometimes makes spelling errors in image labels. Please refer to the lesson text for the correct terminology.