Learning Journey
Watch this topic in 60 seconds
Free preview · Lesson 1
Understanding Making Simple Decisions with Data
Making Simple Decisions with Data
Hello, young decision-makers! Have you ever had to choose something? Maybe what game to play, what snack to eat, or what book to read? We make choices every day! Sometimes, making a good choice can be tricky. But guess what? There's a superpower that can help you make really smart choices: it's called using data!
Think of data like clues in a mystery. If you want to find out who ate the last cookie, you look for crumbs, an open jar, or a happy-looking pet! Each of those is a piece of data, a clue. When you put all the clues together, you can solve the mystery!
What is Data, Anyway?
Simply put, data is information. It's facts, numbers, words, or observations that we collect about something. It could be anything!
- The number of students who like pizza for lunch.
- The different colors of cars that drive past your house.
- How many sunny days we had last month.
- Your friends' favorite animals.
Imagine you're a detective, and your job is to find out what everyone in your class wants to do for a field trip. Every answer you get—“I want to go to the zoo!” or “I want to go to the museum!”—is a piece of data! You're collecting clues to help make the best decision.
Collecting Data: Gathering Our Clues
Before we can use data, we need to gather it! There are many ways to collect data:
- Asking Questions (Surveys): This is like asking your friends what their favorite color is. You might go around and ask everyone.
- Observing: This means watching and noticing things. If you want to know how many red cars pass by, you sit and watch, counting each red car you see.
- Measuring: This involves using tools like rulers or scales. For example, measuring how tall your plant grows each week.
Collecting data is like gathering ingredients for a cake. You can't bake a cake without flour, sugar, and eggs, right? In the same way, you can't make smart decisions without enough data!
Let's say you want to know what game your classmates want to play during indoor recess. You could go around and ask each person. This is collecting data through a survey.

Organizing Data: Making Sense of the Clues
Once you've collected a lot of data, it can look messy, like a pile of unorganized toys! To make it useful, we need to organize it. This means putting it in a neat and tidy way so we can understand it better.
Common ways to organize data for simple decisions:
- Tally Marks: Every time something happens, you make a mark (||||).
- Lists: Just writing down what you find.
- Simple Charts:
- Bar Graphs: Using bars of different heights to show how much of something there is. Taller bar means more!
- Pictographs: Using pictures to represent data. For example, one happy face could mean 5 people like apples.
Organizing data is like putting your toys away in different bins. All your building blocks go in one bin, your stuffed animals in another, and your toy cars in a third. When your toys are organized, it's much easier to find what you're looking for and decide what to play with!
If you asked your class about their favorite colors, you might end up with a list like: Red, Blue, Green, Red, Yellow, Blue, Red... Organizing it with tally marks or a bar graph makes it clear quickly which color is most popular.
Understanding Data: What Do the Clues Tell Us?
After we've collected and organized our data, it's time to look closely and understand what it's telling us. We can ask questions like:
- What happened the most? (The most popular choice)
- What happened the least? (The least popular choice)
- Are there any patterns? (Like, maybe everyone likes sunny days more than rainy days.)
- How many more of one thing than another?
This step is like reading a treasure map. You've gathered the map pieces (collected data), put them together (organized data), and now you're looking at the map to find the 'X' that marks the spot! You're trying to find the important message hidden in the data.
If your bar graph shows a very tall bar for 'pizza' as a favorite lunch, you immediately understand that pizza is the most popular choice. The data is 'speaking' to you!
Making Decisions with Data: Using Our Superpower!
This is where the magic happens! Once you understand what your data is telling you, you can use that information to make a smart decision. It helps you choose wisely, fairly, and sometimes, even predict what might happen!
Here's an example:
Your class is trying to decide on a new class pet. The choices are a hamster or a fish. You decide to collect data:
- Collect Data: You ask every student: "Do you prefer a hamster or a fish for a class pet?"
- Organize Data: You use tally marks:
- Hamster: |||| |||| (10 votes)
- Fish: |||| | (6 votes)
- Understand Data: You see that 10 students prefer a hamster, and only 6 prefer a fish. The hamster has more votes!
- Make a Decision: Based on the data, the class decides to get a hamster because more students wanted one.
Using data to make a decision is like choosing the best path in a video game. If the game shows you that 'Path A' leads to more treasure and 'Path B' leads to more monsters, you'd probably pick Path A, right? The game is giving you data to help you make a good choice!
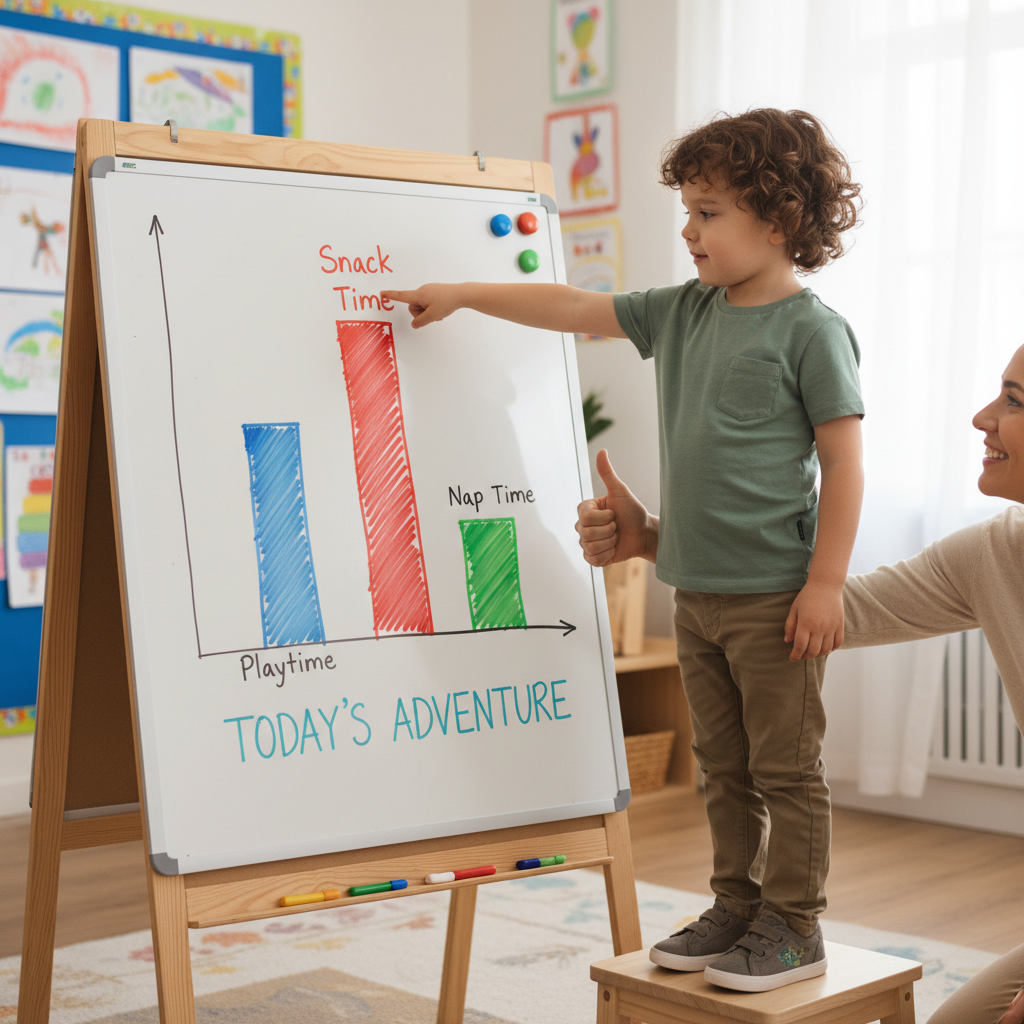
Remember: Data helps us make decisions that are fair and based on facts, not just guesses or what one person wants. It helps us understand what most people think or what usually happens.
Why Is This Superpower Important?
Using data to make decisions helps you:
- Make Better Choices: You're not just guessing; you're using real information.
- Be Fair: It helps you consider what many people want, not just a few.
- Solve Problems: Data can show you why something isn't working and help you find a solution.
- Plan for the Future: If data shows it rains a lot in April, you know to bring your umbrella!
So, the next time you need to make a choice, big or small, think like a data detective! Collect your clues, organize them, understand what they mean, and then make your super-smart decision!
Keep learning, free
Create a free Syllabax account to unlock practice questions and games for this topic.
Visual Learning Enhanced! 🚀
To help you master this topic, we use Advanced Syllabax AI to generate detailed diagrams and visual models.
Note on Visuals: The AI sometimes makes spelling errors in image labels. Please refer to the lesson text for the correct terminology.