Data About Our Favorite Things
Watch this topic in 60 seconds
Free preview · Lesson 1
Understanding Data About Our Favorite Things
Let's Talk About Our Favorite Things: Collecting and Understanding Data!
Hey there, amazing 4th graders! Get ready for an exciting adventure into the world of 'Data About Our Favorite Things.' Have you ever wondered what your classmates like to eat for breakfast, or what their favorite color is? When we ask questions like these and write down the answers, we're doing something super important: we're collecting data!
What is Data? It's Like a Treasure Chest of Information!
Imagine you have a big toy chest. Inside, you have all sorts of toys: cars, dolls, building blocks, stuffed animals. Each toy is a little piece of information about what you like to play with. Data is just like that! It's a collection of facts, numbers, words, or observations that we gather about a specific topic. It's like collecting clues to solve a mystery!
For our topic, 'Data About Our Favorite Things,' the data would be all the answers people give us when we ask about their favorite things. For example, if we ask 'What's your favorite animal?' and someone says 'dog,' 'dog' is a piece of data.
Why do we collect data? Well, just like looking at all the toys in your chest helps you understand what games you can play, looking at data helps us understand things better. It helps us answer questions, make decisions, and see patterns. For instance, if you collect data about everyone's favorite ice cream flavor, you might find out that chocolate is the most popular in your class! That's a cool discovery, right?
Collecting Data: Being a Super Sleuth!
Collecting data is like being a detective! You need to ask questions and carefully record the answers. Let's say you want to find out the favorite fruit of everyone in your class. How would you do it?
- Ask Questions: You could go to each friend and ask, 'What is your favorite fruit?'
- Record Answers: As they tell you, you need a way to write it down. You could use a piece of paper and make a tally mark for each fruit. For example, if three people say 'apple,' you'd draw ||| next to 'apple.'
This process of asking and recording is how we collect data. It's like gathering all the puzzle pieces before you try to put them together.
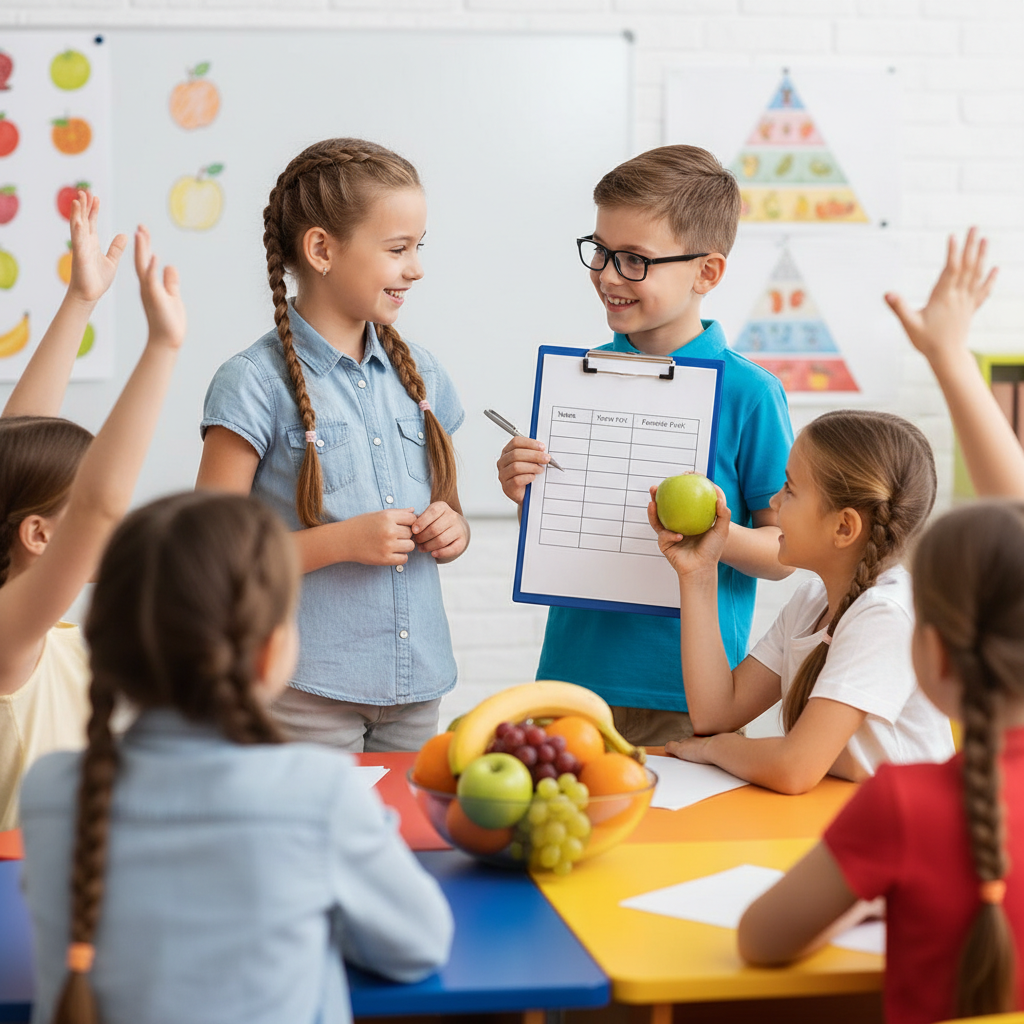
Organizing Data: Making Sense of the Clues!
Once you've collected all your data, it might look a little messy, just like all your toys scattered on the floor. The next step is to organize it. Organizing data means putting it into a neat order so it's easy to understand. Think of it like putting all your cars in one bin, your dolls in another, and your blocks in a third. It makes everything much clearer!
Tables and Tally Charts: Our First Organizing Tools!
One of the best ways to organize data, especially for 'favorite things,' is to use a tally chart or a simple table. Let's go back to our favorite fruit example:
| Favorite Fruit | Tally Marks | Total Number |
|---|---|---|
| Apple | |||| | 4 |
| Banana | ||| | 3 |
| Orange | |||| | | 6 |
| Grape | || | 2 |
See how much clearer that is? You can quickly see how many people like each fruit. Tally marks are super helpful because for every five, you make a diagonal line across the first four (like a fence gate), which makes counting big groups much easier!
Displaying Data: Showing Off Our Discoveries!
Now that our data is all organized, we can make it look even more exciting by creating a picture! This is called displaying data. It's like drawing a map for your treasure chest, showing everyone what's inside in a fun way!
Picture Graphs (Pictographs)
A picture graph (or pictograph) uses pictures to show the data. Each picture stands for a certain number of things. For our favorite fruits, maybe one apple picture could mean one person likes apples. Or, if we have lots of data, one apple picture could mean two people like apples.
For example, using our fruit data:
Favorite Fruits in Class
- Apple: 🍎🍎🍎🍎
- Banana: 🍌🍌🍌
- Orange: 🍊🍊🍊🍊🍊🍊
- Grape: 🍇🍇
(Key: Each fruit emoji stands for 1 person)
Bar Graphs
Another popular way to display data is a bar graph. A bar graph uses bars (like tall buildings!) of different lengths or heights to show the number of things in each category. The longer the bar, the more people chose that favorite thing!
Imagine a bar graph for our favorite fruits:
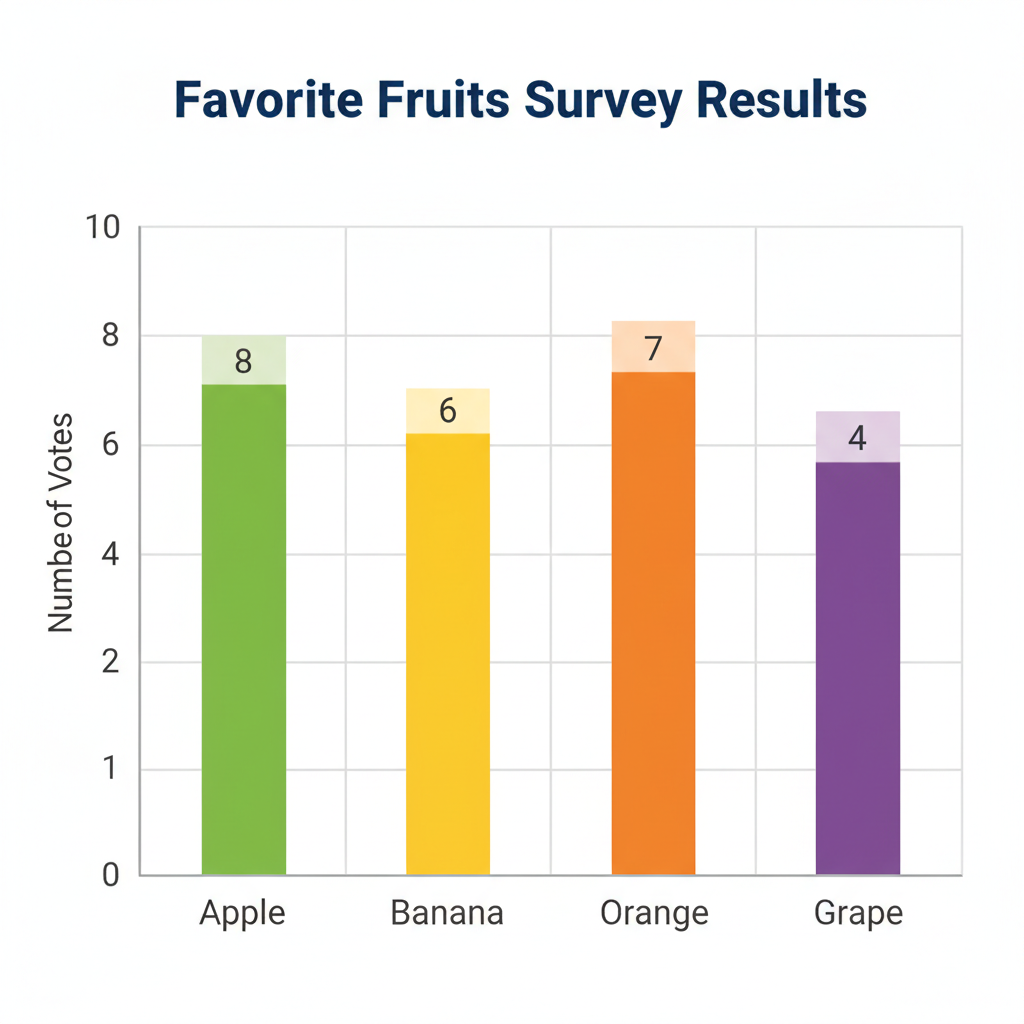
The bottom of the graph would list the fruits (Apple, Banana, Orange, Grape), and the side would have numbers (0, 1, 2, 3, 4, 5, 6...). Then, for each fruit, you'd draw a bar up to the number that tells you how many people liked it. For 'Orange,' the bar would go up to 6!
Why is This Important?
Understanding data helps us make sense of the world around us. It helps us know what's popular, what people prefer, and even how to plan for the future. If you know most of your friends love pizza, you might suggest a pizza party! That's using data to make a decision!
So, next time you're curious about what people like, remember you can be a data detective. Collect the information, organize it neatly, and then show it off in a cool graph!
Keep learning, free
Create a free Syllabax account to unlock practice questions and games for this topic.
Visual Learning Enhanced! 🚀
To help you master this topic, we use Advanced Syllabax AI to generate detailed diagrams and visual models.
Note on Visuals: The AI sometimes makes spelling errors in image labels. Please refer to the lesson text for the correct terminology.