Interpreting Pictographs
Watch this topic in 60 seconds
Free preview · Lesson 1
Understanding Interpreting Pictographs
Unlocking the Picture Code: A Guide to Interpreting Pictographs
Grade 6 | Topic: Interpreting Pictographs | Difficulty: Foundational
What in the World is a Pictograph?
Imagine you're trying to tell someone how many apples you ate this week, but you can only use pictures! That's a bit like what a pictograph is. A pictograph is a special kind of graph that uses pictures or symbols to show information, or 'data'. Instead of using bars or lines, it uses little drawings to represent quantities.
Think of it like a secret code or a picture language! Each little drawing has a meaning, and when you put them all together, they tell you a story about numbers. For example, if you wanted to show how many students chose different favorite fruits, you could draw little pictures of apples, bananas, and oranges instead of just writing down numbers.
The Super Important Parts of a Pictograph
Just like a good story needs a title, characters, and a plot, a pictograph has important parts that help us understand it. Let's break them down:
-
The Title: What's the Story About?
Every good pictograph starts with a clear title. This title tells you what information the pictograph is showing. It's like the headline of a newspaper – it gives you the main idea right away. For instance, a title might be 'Favorite Pet Animals of Class 6A'. -
Categories/Labels: Who or What Are We Counting?
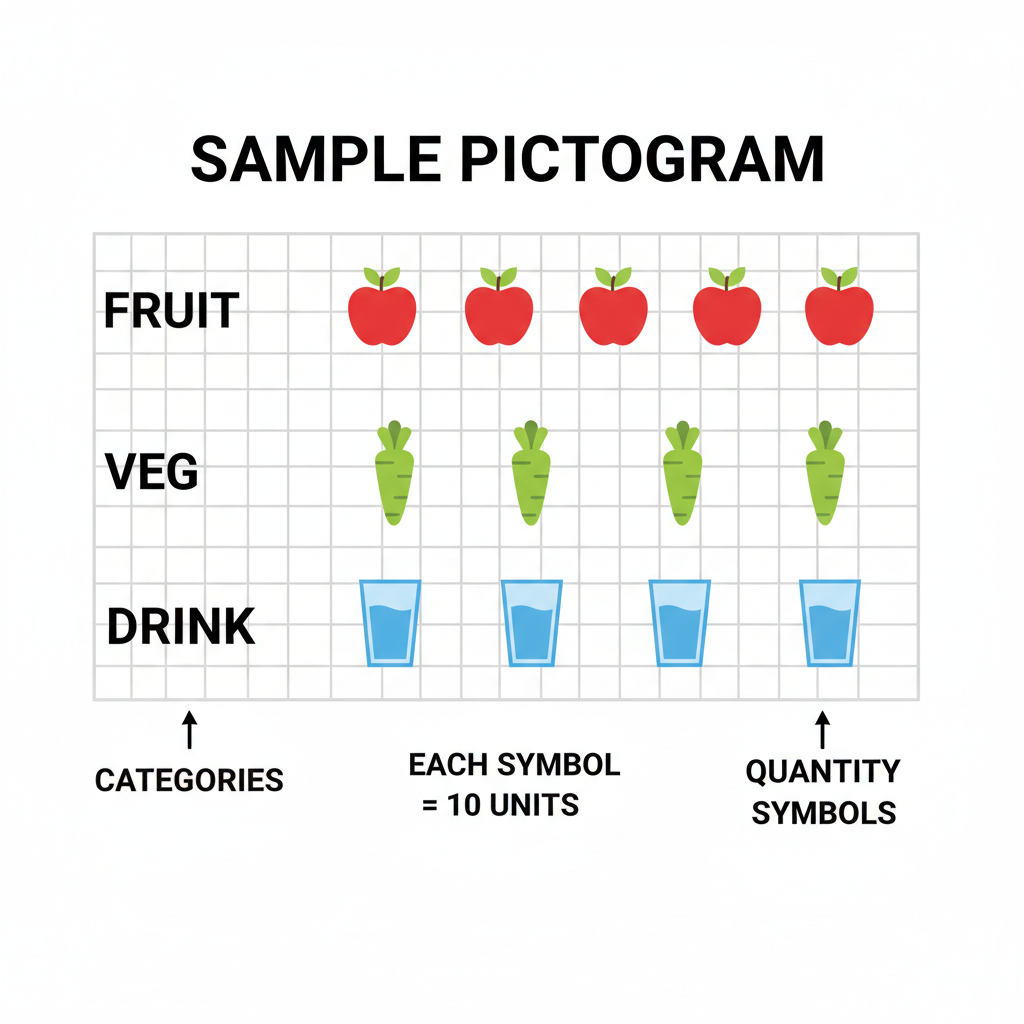
Along one side of the pictograph (usually the left), you'll see different categories or labels. These are the things being counted or compared. In our 'Favorite Pet Animals' example, the labels might be 'Dogs', 'Cats', 'Fish', and 'Birds'. -
The Pictures/Symbols: The Little Drawings!
These are the actual images used in the graph. They could be stars, smileys, little animal drawings, or anything else that makes sense for the data. These pictures are what you'll be counting! -
The KEY (or Legend): The Secret Decoder Ring! ⭐🔑
This is perhaps the MOST important part of a pictograph! The key (sometimes called a legend) is like a dictionary for your pictures. It tells you what each single picture or symbol represents. Without the key, you'd be lost! If a pictograph showed little star symbols, the key might say: '⭐ = 2 students'. This means every time you see one star, it counts as 2 students. If the key said '⭐ = 5 votes', then each star would count as 5 votes.Analogy Time! Imagine you're counting money. You see a coin. Is it worth 1 cent, 5 cents, 10 cents, or 25 cents? You need to know what kind of coin it is to know its value! The key in a pictograph is just like knowing if that coin is a penny, nickel, dime, or quarter. It tells you the value of each picture!
How to Read and Understand a Pictograph (Step-by-Step!)
Now that you know the parts, let's learn how to put them together and read a pictograph like a pro!
-
Step 1: Read the Title. Always start by understanding what the graph is about. What information is it trying to share?
-
Step 2: Look at the Categories. See what different items, groups, or options are being compared.
-
Step 3: FIND THE KEY! This is critical. Locate the key (usually at the bottom or side of the graph) and see what value each picture represents. For example, if the key says 'Each 🍎 = 10 apples', remember that each apple drawing means ten actual apples.
-
Step 4: Count the Pictures (and use the key!). For each category, count how many pictures or symbols there are. Then, multiply that count by the value given in the key. If there are 3 🍎 symbols and the key says '🍎 = 10 apples', then that category has 3 x 10 = 30 apples.
What about half pictures? Sometimes, you might see half a picture or symbol. This means it represents half of the value shown in the key. If '🍎 = 10 apples', then ' অর্ধেক 🍎 ' (half an apple) would mean 5 apples (half of 10).
Another Analogy: Imagine a baker's recipe. It says '1 cup of flour'. If a pictograph showed '1 measuring cup symbol = 2 cups of flour', and you saw 3 full measuring cup symbols and 1 half measuring cup symbol, you'd know that's (3 x 2) + (0.5 x 2) = 6 + 1 = 7 cups of flour!
-
Step 5: Answer the Questions! Once you've figured out the total value for each category, you can easily answer questions like 'Which category has the most?', 'How many more are in one category than another?', or 'What is the total count across all categories?'
Why Are Pictographs Useful?
Pictographs are great because they make numbers and data easy to understand at a glance, even for people who don't like looking at long lists of numbers. They are visually appealing and can help us quickly compare different amounts. It's like seeing a picture book instead of a big book of just words – sometimes, pictures just tell the story better!
Let's Recap!
Interpreting pictographs is all about knowing what each part means, especially the key! With a little practice, you'll be a master at decoding these picture puzzles and understanding the data they show.
Keep learning, free
Create a free Syllabax account to unlock practice questions and games for this topic.
Visual Learning Enhanced! 🚀
To help you master this topic, we use Advanced Syllabax AI to generate detailed diagrams and visual models.
Note on Visuals: The AI sometimes makes spelling errors in image labels. Please refer to the lesson text for the correct terminology.