Stem-and-Leaf Plots
Watch this topic in 60 seconds
Free preview · Lesson 1
Understanding Stem-and-Leaf Plots
Understanding Stem-and-Leaf Plots: Organizing Data Like a Pro!
Hey there, future data whizzes! Imagine you have a jumbled pile of information – maybe the scores from a recent quiz, the number of push-ups your classmates can do, or even the ages of people attending a concert. How do you make sense of it all? How do you see patterns, find the most common values, or understand the spread of the data without getting lost in a sea of numbers?
That's where a fantastic tool called a Stem-and-Leaf Plot comes in! It’s like a super-powered organizer that helps you sort numbers in a neat, visual way, much clearer than just a plain list. Think of it as a blend between a simple list of data and a graph, giving you the best of both worlds.
What Exactly Is a Stem-and-Leaf Plot?
At its heart, a stem-and-leaf plot is a special table that separates each data value into two parts: a 'stem' and a 'leaf'. It's a clever way to display numerical data where each data point is broken down into its leading digit(s) (the stem) and its trailing digit (the leaf).
Analogy Time: The Bookshelf Organizer!
Let's use an analogy to make this super clear. Imagine your local library wants to organize books by their call numbers (which are often numbers like '345', '789', '123', etc.). Instead of just piling them up, they want to see how many books they have in the '300s' or '700s' sections, and then specifically what books they have within those sections.
- The Stem is like the main shelf number (e.g., the '3' in 345, or the '7' in 789). It represents the first digit or digits of your data point.
- The Leaf is like the specific book's number on that shelf (e.g., the '45' in 345, or the '89' in 789, but for a basic stem-and-leaf plot, it's usually just the *last* digit).
So, a book with the call number '345' would be on 'shelf 3', and its 'leaf' would be '5'. The librarians would put all the '300s' books together, and then list their specific last digits on that 'shelf'. This way, they can quickly see how many books are on shelf 3, and which specific ones they are!
The Core Components: Stem, Leaf, and Key
1. The Stem: The Main Categories
The 'stem' consists of the leading digit(s) of your data values. These are usually the tens, hundreds, or even thousands digits. All the data values that share the same leading digit(s) will share the same stem. Think of the stem as the 'category' or 'group' for a set of numbers.
Example: If your data includes numbers like 23, 27, 31, 35, 38, 40, 42:
- For 23 and 27, the stem is 2 (representing 20s).
- For 31, 35, and 38, the stem is 3 (representing 30s).
- For 40 and 42, the stem is 4 (representing 40s).
2. The Leaf: The Specific Details
The 'leaf' is the trailing digit – almost always the very last digit of a number. Each leaf represents one individual data point. It's the unique part that distinguishes one number from another within the same stem category.
Example (continuing from above):
- For 23, the stem is 2, the leaf is 3.
- For 27, the stem is 2, the leaf is 7.
- For 31, the stem is 3, the leaf is 1.
- And so on...
3. The Key: The Decoder Ring!
This is crucial! The 'key' tells you how to read the stem-and-leaf plot. Without it, you wouldn't know if '2 | 3' means 23, 2.3, or 230! It's like the legend on a map, explaining what all the symbols mean.
A typical key looks like: 2 | 3 means 23. This clearly states that the stem '2' and the leaf '3' combine to form the number '23'. If your numbers were decimals like 2.3, the key would be 2 | 3 means 2.3.
How to Build Your Own Stem-and-Leaf Plot (Step-by-Step!)
Let's get practical! Here's how to create a stem-and-leaf plot from a set of data. We'll use the following quiz scores for 15 students:
15, 22, 18, 25, 30, 21, 19, 22, 28, 33, 24, 17, 26, 31, 29
Step 1: Order Your Data (Smallest to Largest)
This is super important for making your plot easy to read and for quickly seeing patterns. It's like organizing your books alphabetically before putting them on the shelves!
Ordered data: 15, 17, 18, 19, 21, 22, 22, 24, 25, 26, 28, 29, 30, 31, 33
Step 2: Identify Stems and Leaves
Look at your ordered data. What are the leading digits? What are the trailing digits?
- For numbers in the teens (10s), the stem is 1. The leaves are 5, 7, 8, 9.
- For numbers in the twenties (20s), the stem is 2. The leaves are 1, 2, 2, 4, 5, 6, 8, 9.
- For numbers in the thirties (30s), the stem is 3. The leaves are 0, 1, 3.
Step 3: Draw the Plot
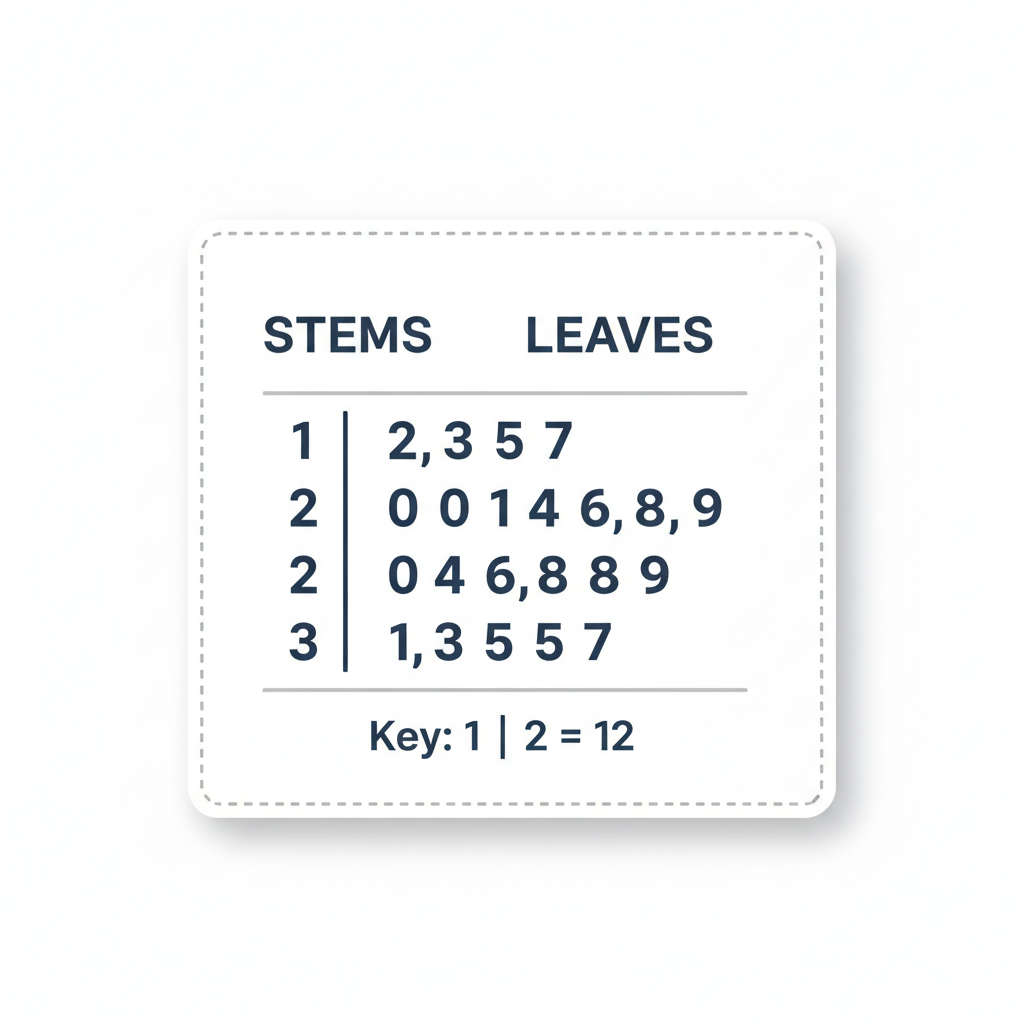
Draw a vertical line. Write the stems in increasing order on the left side of the line. Make sure to list all possible stems, even if some don't have leaves (e.g., if there were no 0-9 scores, you'd still list a stem of 0, but no leaves beside it). On the right side of the line, for each stem, write its corresponding leaves in increasing order.
Stem | Leaves
-----+-----------------
 1   | 5 7 8 9
 2   | 1 2 2 4 5 6 8 9
 3   | 0 1 3
Step 4: Add a Key
Don't forget the key! It's the most important instruction.
Key: 1 | 5 means 15
Step 5: Add a Title
Give your plot a clear and descriptive title so anyone looking at it knows exactly what the data represents.
Quiz Scores of 15 Students
Stem | Leaves
-----+-----------------
 1   | 5 7 8 9
 2   | 1 2 2 4 5 6 8 9
 3   | 0 1 3

Key: 1 | 5 means 15
Interpreting Your Stem-and-Leaf Plot: Reading the Story in the Numbers
Now that you've built it, what can you learn from it? A stem-and-leaf plot is powerful because it keeps all the original data values while also showing you the shape and distribution of the data. It's like looking at a busy street (the data) and immediately noticing where the cars are clumped together, where there are gaps, and how wide the road is (the spread).
- Shape of the Data: Turn the plot on its side (or imagine it horizontal). Does it look balanced (symmetric)? Or does it have a long 'tail' to one side (skewed)? For our quiz scores, if you rotate it, you might notice that most scores are in the 20s, indicating a central tendency around that range.
- Clusters and Gaps: You can easily spot where most of the data points are grouped (clusters) and where there are no data points (gaps). In our example, the biggest cluster is clearly in the '2' stem, meaning most students scored in the 20s.
- Outliers: If there's a stem with only one or two leaves far away from the main body of the data, it might indicate an 'outlier' – a value that is unusually high or low compared to the rest.
- Mode: The mode is the most frequent value. You can find it by looking for leaves that repeat on the same stem. In our example, '2' appears twice on the '2' stem (meaning 22 appeared twice), so 22 is a mode.
- Median: The median is the middle value when the data is ordered. Since a stem-and-leaf plot already orders your data, you can simply count from either end to find the middle leaf. With 15 data points, the 8th value will be the median. Counting 8 leaves from the top (15, 17, 18, 19, 21, 22, 22, 24), the median is 24.
Why Use Stem-and-Leaf Plots? (Pros and Cons)
Advantages:
- Keeps Original Data: Unlike a histogram, which groups data into bins and loses individual values, a stem-and-leaf plot preserves every single data point. You can literally read all the original numbers directly from the plot!
- Quick to Construct: For small to medium-sized datasets, they're relatively fast and easy to make by hand.
- Shows Data Distribution: You get a clear visual picture of how the data is spread out, where values are concentrated, and if there are any unusual scores.
Disadvantages:
- Not Great for Large Datasets: If you have hundreds or thousands of data points, a stem-and-leaf plot can become very long, messy, and hard to read. Imagine a bookshelf with thousands of books on each shelf – it would be overwhelming!
- Less Precise for Very Wide Ranges: If your data ranges from 1 to 1000, creating stems for every hundred or ten might not be practical.
Conclusion
Stem-and-leaf plots are a fantastic foundational tool in statistics. They offer a unique way to organize, visualize, and understand numerical data, especially when you want to retain the individual data points. By mastering the concepts of stems, leaves, and keys, and practicing how to construct and interpret these plots, you'll gain a powerful skill for making sense of numbers in the world around you. So go forth, organize your data, and discover the hidden stories within the numbers!
Keep learning, free
Create a free Syllabax account to unlock practice questions and games for this topic.
Visual Learning Enhanced! 🚀
To help you master this topic, we use Advanced Syllabax AI to generate detailed diagrams and visual models.
Note on Visuals: The AI sometimes makes spelling errors in image labels. Please refer to the lesson text for the correct terminology.