Distance–time graph interpretation (Graph Basics)
Watch this topic in 60 seconds
Free preview · Lesson 1
Understanding Distance–time graph interpretation (Graph Basics)
Understanding Distance-Time Graphs: Your Map to Motion!
Have you ever tried to tell a story about a journey you took? Maybe you walked to the park, stopped for a moment to tie your shoe, and then ran the rest of the way. How could you show someone exactly how far you went and how long it took you, moment by moment? That's where distance-time graphs come in! Think of them as a special kind of map that plots out motion over time, telling the 'story' of a journey in a visual way.
In this lesson, we're going to unlock the secrets of these graphs. By the end, you'll be able to look at a distance-time graph and understand exactly what's happening – whether something is moving fast, slow, or not at all!
The Basic Building Blocks: Axes and Units
Every graph has two main lines, called axes, that help us plot information. Imagine a cross, like a plus sign:
- The line running horizontally (left to right) is the x-axis. On a distance-time graph, this axis always represents time. Think of it like the hands of a clock ticking away – time keeps moving forward, no matter what. Time is the independent variable because it progresses on its own. You'll often see time measured in seconds (s), minutes (min), or hours (hr).
- The line running vertically (up and down) is the y-axis. On a distance-time graph, this axis always represents distance. This is the 'how far' part of our story. Distance is the dependent variable because the distance an object travels depends on how much time has passed and how fast it's moving. You'll often see distance measured in meters (m), kilometers (km), or miles (mi).
So, a distance-time graph basically asks: "At this specific time (x-axis), how far away is the object from its starting point (y-axis)?"
Reading the 'Story' of the Line: What Do Different Lines Mean?
The line drawn on the graph tells us everything about the object's motion. Let's explore the most common 'chapters' you'll find:
1. The Flat Line: Standing Still (Stationary)
Imagine you're standing perfectly still, waiting for a bus. As time passes (the x-axis moves forward), your distance from your starting point (where you began waiting) doesn't change. What would this look like on a graph?
It would be a flat, horizontal line. Like a flat road, there's no change in height (distance) even though you're moving forward in time. This tells us the object is stationary, or not moving.
- Analogy: Think of a car parked in a driveway. As minutes turn into hours, the car's distance from the house remains the same. On a distance-time graph, this would be a flat line.
2. The Straight Sloping Line: Moving at a Constant Speed
Now, imagine you start walking at a steady pace, without speeding up or slowing down. Every second, you cover the same amount of distance. What would this look like?
It would be a straight line that slopes upwards or downwards. This means the object is moving at a constant speed. The distance changes steadily over time.
- Upward Slope: Moving Away
If the line slopes upwards (from bottom-left to top-right), it means the object is moving further away from its starting point. Like climbing a steady hill, your 'distance' (height) increases consistently. - Downward Slope: Moving Towards / Returning
If the line slopes downwards (from top-left to bottom-right), it means the object is moving closer to its starting point, or returning. Like walking down a steady hill, your 'distance' (height) decreases consistently. - Steeper Slope = Faster Speed: Think about skiing down a hill. A very steep hill means you go much faster than a gentle slope. The same applies to distance-time graphs: a steeper line (whether upwards or downwards) indicates a faster constant speed.
- Less Steep Slope = Slower Speed: Conversely, a less steep line means the object is moving at a slower constant speed.
- Analogy: A car using cruise control on a highway is moving at a constant speed. Its distance-time graph would be a straight, sloping line. If it speeds up, the line gets steeper; if it slows down (but still constant), the line is less steep.
3. The Curved Line: Changing Speed (Acceleration or Deceleration)
What if you're not moving at a steady pace? What if you're speeding up or slowing down? Think about a car accelerating from a stoplight or braking to a stop.
When an object's speed is changing, the line on the distance-time graph will be curved.
- Speeding Up (Acceleration): If the curve gets progressively steeper (like an upward-curving ramp), the object is speeding up, or accelerating. This means it's covering more distance in each passing unit of time.
- Slowing Down (Deceleration): If the curve gets progressively flatter (like a ramp smoothing out), the object is slowing down, or decelerating. This means it's covering less distance in each passing unit of time.
- Analogy: Imagine a roller coaster. As it drops down a hill, it accelerates, and its distance-time graph would curve sharply downwards. As it approaches the end of the ride, it slows down, and its graph would curve to become flatter.
Calculating Speed: The Slope of the Line
One of the most powerful things you can do with a distance-time graph is calculate the speed of the object during a particular segment of its journey. Remember, speed tells us how quickly an object is covering distance.
Mathematically, the speed of an object is represented by the slope (or gradient) of the line on a distance-time graph.
Speed = Change in Distance / Change in Time
Let's say a line segment on your graph goes from (Time 1, Distance 1) to (Time 2, Distance 2):
- Change in Distance = Distance 2 - Distance 1
- Change in Time = Time 2 - Time 1
- Speed = (Distance 2 - Distance 1) / (Time 2 - Time 1)
Example: If a person walks 10 meters in 5 seconds:
- Change in Distance = 10 m
- Change in Time = 5 s
- Speed = 10 m / 5 s = 2 meters per second (m/s)
The units for speed will always be a distance unit divided by a time unit (e.g., m/s, km/hr, mi/hr).
Putting It All Together: A Full Journey!
Most journeys aren't just one straight line! They involve starting, stopping, moving fast, moving slow, and maybe even returning. A distance-time graph can show all these changes in motion in a single picture.
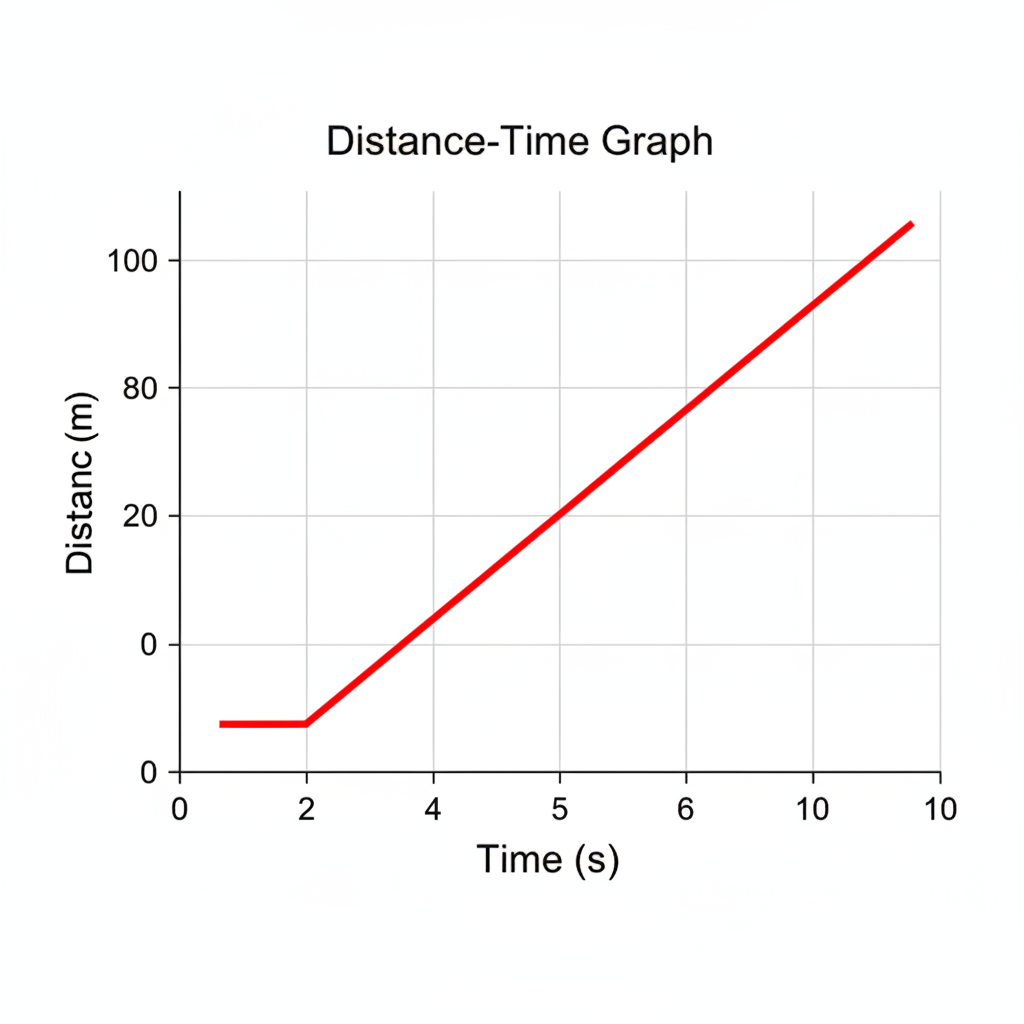
Imagine the graph above represents a person's walk:
- Segment 1 (Flat Line): The person is stationary, perhaps waiting for a friend for a few seconds. Their distance from the start doesn't change.
- Segment 2 (Steep Upward Slope): The person starts walking away from their starting point at a fast, constant speed.
- Segment 3 (Less Steep Upward Slope): The person continues walking away, but now at a slower, constant speed, maybe they got tired.
By breaking down the graph into these different segments, you can describe the entire 'story' of the object's movement!
Summary and Why It Matters
Distance-time graphs are powerful tools for understanding motion. They allow us to visualize how far an object has traveled over a certain period and at what speed. They are used in many fields, from physics and engineering to everyday tasks like planning travel. Learning to interpret these graphs gives you a fundamental skill in analyzing the world around you.
Keep learning, free
Create a free Syllabax account to unlock practice questions and games for this topic.
Visual Learning Enhanced! 🚀
To help you master this topic, we use Advanced Syllabax AI to generate detailed diagrams and visual models.
Note on Visuals: The AI sometimes makes spelling errors in image labels. Please refer to the lesson text for the correct terminology.