Visualizing Data: Pictographs
Watch this topic in 60 seconds
Free preview · Lesson 1
Understanding Visualizing Data: Pictographs
Visualizing Data: Pictographs - Understanding Data with Pictures!
Hey there, future data detectives! Have you ever tried to understand a whole lot of information all at once? Maybe you're trying to figure out which sport is most popular in your class, or which type of snack your family eats the most. When you have a lot of facts and numbers, it can sometimes feel like trying to drink water from a firehose – way too much to take in! This is where something super cool called "data visualization" comes in. It's like taking all those facts and numbers and turning them into easy-to-understand pictures.
What is Data Visualization? A Story Through Pictures!
Imagine you have a big pile of puzzle pieces. If you just look at the pile, it's hard to see what the final picture will be. But when you start putting the pieces together, the picture slowly appears! That's what data visualization does with information, or "data." It takes raw facts and figures and turns them into visual things like charts and graphs, making them much easier for our brains to understand quickly.
Think of it like telling a story without using too many words. Instead of reading a long paragraph about how many cookies each friend ate, wouldn't it be easier to see a picture where each friend has a pile of cookies next to their name?
Introducing Pictographs: Data's Sticker Chart!
What is a Pictograph?
A pictograph (say it with me: PIC-toh-graf) is a special kind of chart that uses pictures or symbols to represent data. Instead of using bars like a bar graph or slices like a pie chart, a pictograph uses small, identical images to show quantities. It's like a sticker chart for information! Each sticker (or picture) stands for a certain number of items.
Analogy: Imagine your teacher keeps track of good behavior with a sticker chart. Each sticker represents one good deed. If you have 5 stickers, you know you did 5 good deeds. A pictograph works the exact same way!
Why Use a Pictograph?
Pictographs are super handy for a few reasons:
- They are very easy to understand, even for young kids, because our brains love looking at pictures.
- They are visually appealing – pictures are often more fun to look at than just numbers!
- They quickly show comparisons – you can see at a glance which category has more or less just by looking at the number of pictures.
The Secret Ingredients of a Pictograph: Decoding the Data!
Just like a delicious recipe needs specific ingredients, a good pictograph needs a few important parts. Let's explore them:
1. The Title: What's the Story About?
Every good pictograph needs a title. The title tells you exactly what information the pictograph is showing. It's like the name of a book or a movie – it gives you a hint about what you're about to see.
Analogy: If you see a book titled "The Adventures of Captain Underpants," you immediately know it's about Captain Underpants and his adventures. A pictograph's title does the same thing for its data!
2. Categories or Labels: What Are We Comparing?
Along the side or bottom of the pictograph, you'll see different categories or labels. These are the different things being compared. For example, if you're tracking favorite fruits, the labels might be "Apples," "Bananas," "Oranges," and "Grapes."
Analogy: Think of a menu at an ice cream shop. The labels are like the different flavors of ice cream you can choose from: Vanilla, Chocolate, Strawberry. Each is a separate category.
3. The Symbols/Pictures: The Building Blocks of Data!
These are the actual pictures or images used in the pictograph. Each picture represents a certain amount of data. For instance, if you're making a pictograph about favorite pets, you might use a tiny paw print or a small picture of an animal.
Analogy: If your ice cream shop uses pictographs to show how many scoops of each flavor they sold, the 'symbol' would be a small picture of an ice cream scoop!
4. The Key or Legend: Your Data Decoder Ring!
This is arguably the MOST important part of a pictograph! The key (also called a legend) tells you exactly what each picture or symbol stands for. Without the key, you wouldn't know if one picture means 1 item, 5 items, or 100 items!
Analogy: Imagine you found a treasure map. You see 'X' marks on the map, but without a 'legend' telling you what 'X' means (e.g., "X marks the spot of 10 gold coins"), you wouldn't know how much treasure is there! The key is your decoder ring for the data.
For example, a key might say: = 2 Apples. This means every time you see one apple picture, it counts as 2 actual apples.
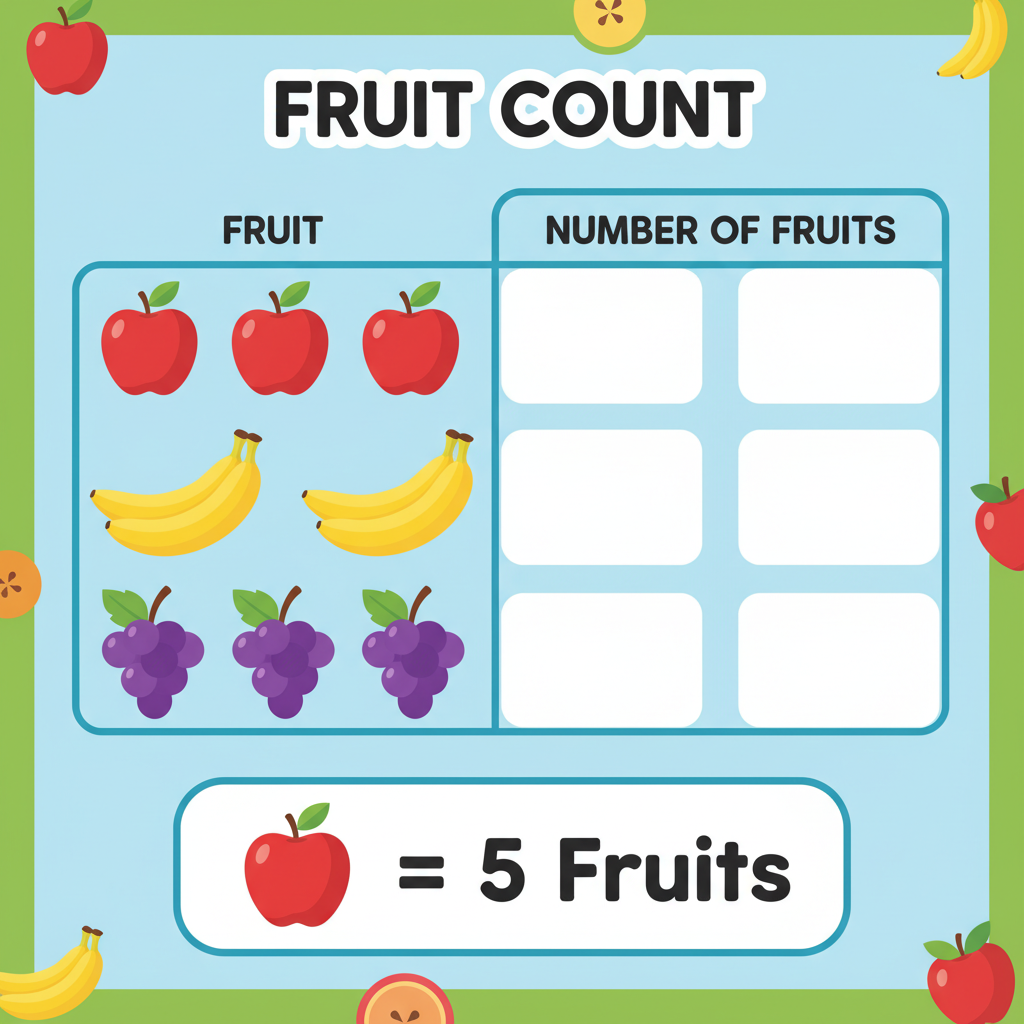
How to Read a Pictograph: Step-by-Step!
Reading a pictograph is like solving a fun puzzle. Here's how to do it:
- Read the Title: First, look at the title. What is this pictograph trying to tell you about?
- Look at the Categories: Next, see what different categories of information are being shown. These are usually listed down the side or across the bottom.
- Find the Key: THIS IS CRUCIAL! Locate the key (or legend). It will tell you how much each picture symbol is worth. For example,
 = 5 students.
- Count the Pictures: For each category, count how many pictures are shown.
- Do the Math: Multiply the number of pictures you counted by the value given in the key. If you see 3 stars and the key says 1 star = 5 students, then 3 stars * 5 students/star = 15 students.
- Compare and Conclude: Now you can compare the different categories and draw conclusions! Which category has the most? Which has the least?
Let's Try an Example Together (without a physical image, just imagined):
Imagine a pictograph titled "Favorite Ice Cream Flavors in Room 6B".
Categories: Chocolate, Vanilla, Strawberry, Mint Chip.
Key: = 3 students.
- Chocolate:
 ⚠️ This picture may have spelling mistakes. Trust the words in the lesson.
 ⚠️ This picture may have spelling mistakes. Trust the words in the lesson. (4 cones)
- Vanilla: (2 cones)
- Strawberry:
 ⚠️ This picture may have spelling mistakes. Trust the words in the lesson. (3 cones)
- Mint Chip:
 ⚠️ This picture may have spelling mistakes. Trust the words in the lesson. (1 cone)
Let's decode:
- Chocolate: 4 cones * 3 students/cone = 12 students.
- Vanilla: 2 cones * 3 students/cone = 6 students.
- Strawberry: 3 cones * 3 students/cone = 9 students.
- Mint Chip: 1 cone * 3 students/cone = 3 students.
From this, we can easily see that Chocolate is the most popular flavor, and Mint Chip is the least popular among these choices!
When Pictographs Can Be Tricky (and When They Are Best!)
While pictographs are fantastic for making data easy and fun to look at, they do have a few limitations:
- Large Numbers: If you have very, very big numbers (like hundreds or thousands), you would need a lot of tiny pictures, or each picture would have to represent a huge number. This can sometimes make it harder to be super precise.
- Fractions: Sometimes you might need to show half of a symbol (like half a car) to represent half of the value in the key. This is okay, but you usually don't want to use quarters or other smaller fractions, as it gets confusing!
They are best for showing data where the numbers aren't too massive, and where you want to quickly compare different categories in a simple, visual way.
Putting It All Together: Your Superpower of Understanding Data!
Now you know the power of pictographs! You can look at a chart filled with pictures and, by understanding the title, categories, and most importantly, the key, you can quickly become a data expert. You've learned to decode information presented in a fun and visual way. This skill isn't just for school; it helps you understand information you see in newspapers, on the internet, and even in games! Keep practicing, and soon you'll be spotting patterns and understanding data like a pro!
Keep learning, free
Create a free Syllabax account to unlock practice questions and games for this topic.
Visual Learning Enhanced! 🚀
To help you master this topic, we use Advanced Syllabax AI to generate detailed diagrams and visual models.
Note on Visuals: The AI sometimes makes spelling errors in image labels. Please refer to the lesson text for the correct terminology.