Understanding Bar Graphs
Watch this topic in 60 seconds
Free preview · Lesson 1
Understanding Understanding Bar Graphs
Understanding Bar Graphs: A Fun Way to See Information!
Hey amazing fourth graders! Have you ever tried to tell a story or explain something using only numbers and words, and found it a little tricky? Sometimes, looking at a long list of numbers can feel like trying to find one tiny toy in a giant, messy toy box. It's hard to see what's what!
Well, guess what? There's a super cool tool that helps us make sense of numbers and information by turning it into pictures. It's called a Bar Graph! Think of it like a magic window that shows you a clear picture of all your numbers, making them much easier to understand.
What is Data? (It's not scary, promise!)
Before we jump into bar graphs, let's talk about data. Data is just a fancy word for information or facts that we collect. It could be anything! Like, how many red crayons you have, how many friends like pizza, or how many sunny days there were last month. It's like gathering all your favorite toys into a pile – each toy is a piece of data.
Why Do We Need Bar Graphs?
Imagine you have a big collection of colorful building blocks. If they're all just dumped on the floor, it's hard to see how many of each color you have, right? But what if you stacked all the red blocks together, all the blue blocks together, and all the yellow blocks together? Suddenly, it's super easy to see which color stack is the tallest and which is the shortest! You can instantly compare them.
That's exactly what a bar graph does for information! It takes all those numbers and facts (our data) and stacks them up into bars, so we can see and compare them very quickly and easily.
What Does a Bar Graph Look Like?
A bar graph uses rectangles, called bars, to show different amounts of things. These bars can stand up tall (like skyscrapers!) or lie flat on their sides. The taller or longer a bar is, the more of that thing there is. The shorter or smaller a bar is, the less of that thing there is.
The Important Parts of a Bar Graph
Just like a car has wheels, an engine, and seats, a bar graph has different parts that work together to help us understand the information.
1. The Title: The Graph's Name Tag!
Every bar graph needs a title. This is like the name of a book or the title of a movie. It tells you exactly what the graph is all about. For example, if the graph is about how many students chose different favorite pets, the title might be "Favorite Pets of Class 4A." Without a title, you wouldn't know what you're looking at!
2. The Axes (Say: AX-eez): The Graph's Roads!
A bar graph has two main lines that act like roads: the X-axis and the Y-axis.
- X-axis (Horizontal Axis): This is the line that goes straight across, like the horizon where the sky meets the land. It's usually where you'll find the names of the categories or things you are counting. For example, if you're counting favorite fruits, the X-axis might have "Apples," "Bananas," and "Oranges." Think of it as the 'what' we are counting.
- Y-axis (Vertical Axis): This is the line that goes straight up and down, like a very tall tree. It's usually where you'll find the numbers that tell you 'how many.' This is called the scale.
3. Labels: Names for Everything!
Just like you have a name, the X-axis and Y-axis have labels too! These labels tell you what the things on each axis represent. For example, the label for the X-axis might be "Type of Pet," and the label for the Y-axis might be "Number of Students." These labels help avoid confusion.
4. The Bars: Our Stacks of Information!
These are the colorful rectangles! Each bar represents a different category or item from your X-axis. The height or length of the bar shows you how much or how many of that item there are. Remember, taller means more, shorter means less!
5. The Scale: Our Counting Ladder!
The scale is the set of numbers along one of the axes (usually the Y-axis when bars go up). It tells you how much each line or mark represents. Sometimes, the numbers go up by 1s (0, 1, 2, 3...), sometimes by 2s (0, 2, 4, 6...), or even by 5s or 10s. The scale helps you read the height of each bar correctly. It's like the markings on a ruler!
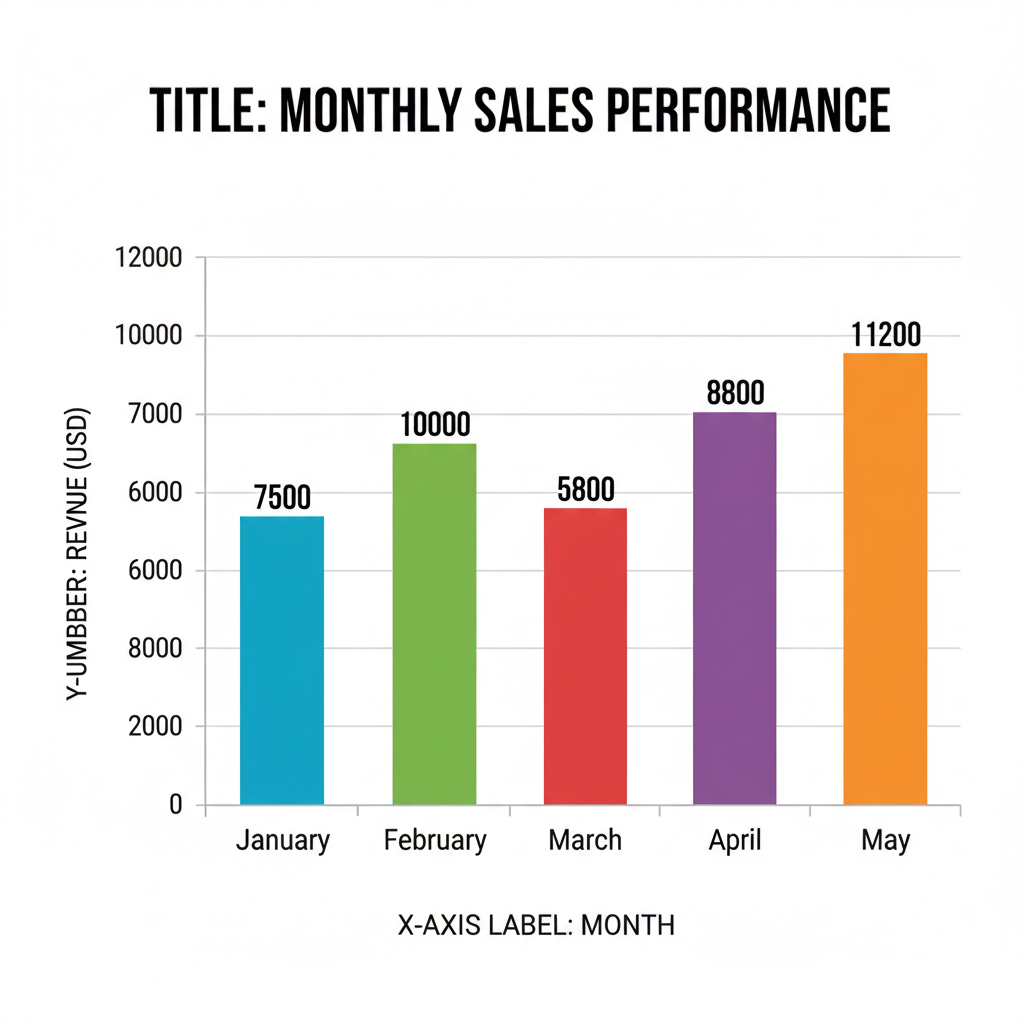 ⚠️ This picture may have spelling mistakes. Trust the words in the lesson.
How to Read a Bar Graph
Reading a bar graph is like being a detective! You're looking for clues to answer questions.
- Read the Title: First, always look at the title to know what the graph is about.
- Look at the Axes Labels: Next, see what the X-axis and Y-axis are measuring. What categories are shown? What do the numbers mean?
- Check the Scale: Understand how the numbers are counting on the Y-axis (by 1s, 2s, 5s?).
- Read the Bars: Find the bar you're interested in. Follow its top (if it's standing up) or its end (if it's lying down) across to the Y-axis to see its value.
- Compare! This is where bar graphs shine! You can quickly see which bar is tallest (the most), which is shortest (the least), and compare how much more or less one category has than another.
Let's Practice a Little!
Imagine a graph titled "Favorite Colors." On the X-axis, we have colors: Red, Blue, Green. On the Y-axis, we have "Number of Students" counting by 1s. If the "Red" bar goes up to 5, it means 5 students like red. If the "Blue" bar goes up to 8, then 8 students like blue. If "Green" goes up to 3, then 3 students like green.
- Which color is most popular? Blue (because its bar is the tallest!).
- Which color is least popular? Green (because its bar is the shortest!).
- How many more students like Blue than Green? 8 - 3 = 5 students!
See? It's like taking a snapshot of all the information and making it super clear!
Bar Graphs in the Real World
Bar graphs aren't just for school! People use them everywhere:
- Scientists use them to show how many different animals they counted.
- News reporters use them to show how many people voted for different things.
- Your parents might even use them to see how much money they spent on different things!
They are a powerful tool to help us understand numbers and information in a quick and easy way. Keep an eye out for them, and you'll start seeing bar graphs all around you!
Keep learning, free
Create a free Syllabax account to unlock practice questions and games for this topic.
Visual Learning Enhanced! 🚀
To help you master this topic, we use Advanced Syllabax AI to generate detailed diagrams and visual models.
Note on Visuals: The AI sometimes makes spelling errors in image labels. Please refer to the lesson text for the correct terminology.