Data in Our World
Watch this topic in 60 seconds
Free preview · Lesson 1
Understanding Data in Our World
Data Detectives: Uncovering the Secrets of Our World!
Hey there, young data detectives! Have you ever wondered how we know how many kids like apples, or what the weather will be like tomorrow? The secret is something called data! Data is everywhere, and it helps us understand the world around us. Think of it like a giant treasure hunt for information!
What is Data?
In simple words, data is information. It's facts, numbers, words, and even pictures and sounds that tell us something. It's like the ingredients in a yummy cake recipe. Each ingredient, like flour, sugar, or eggs, is a piece of data. They all come together to tell you what kind of cake you're making and how it will taste!
Imagine you're trying to figure out what your friend's favorite animal is. Their answer, "A dog!" is a piece of data. If you count how many pencils are on your desk (let's say 5), that number is also a piece of data. Data helps us answer questions like: How many? What kind? What color? How much? And even, what does it look like?
Where Do We Find Data? (Data is Everywhere!)
Data is like tiny little clues scattered all around us, just waiting for a super detective (that's you!) to find them. You can find data:
- In numbers: The number of students in your class, the score in a game, how many steps you take.
- In words: Your favorite color (red, blue, green), the name of your pet (Fluffy, Buddy), the kind of fruit you like (apple, banana).
- In pictures: A photo of your family, a drawing of a tree, a map of your neighborhood.
- In sounds: The chirping of a bird, the ring of a bell, the music you listen to.
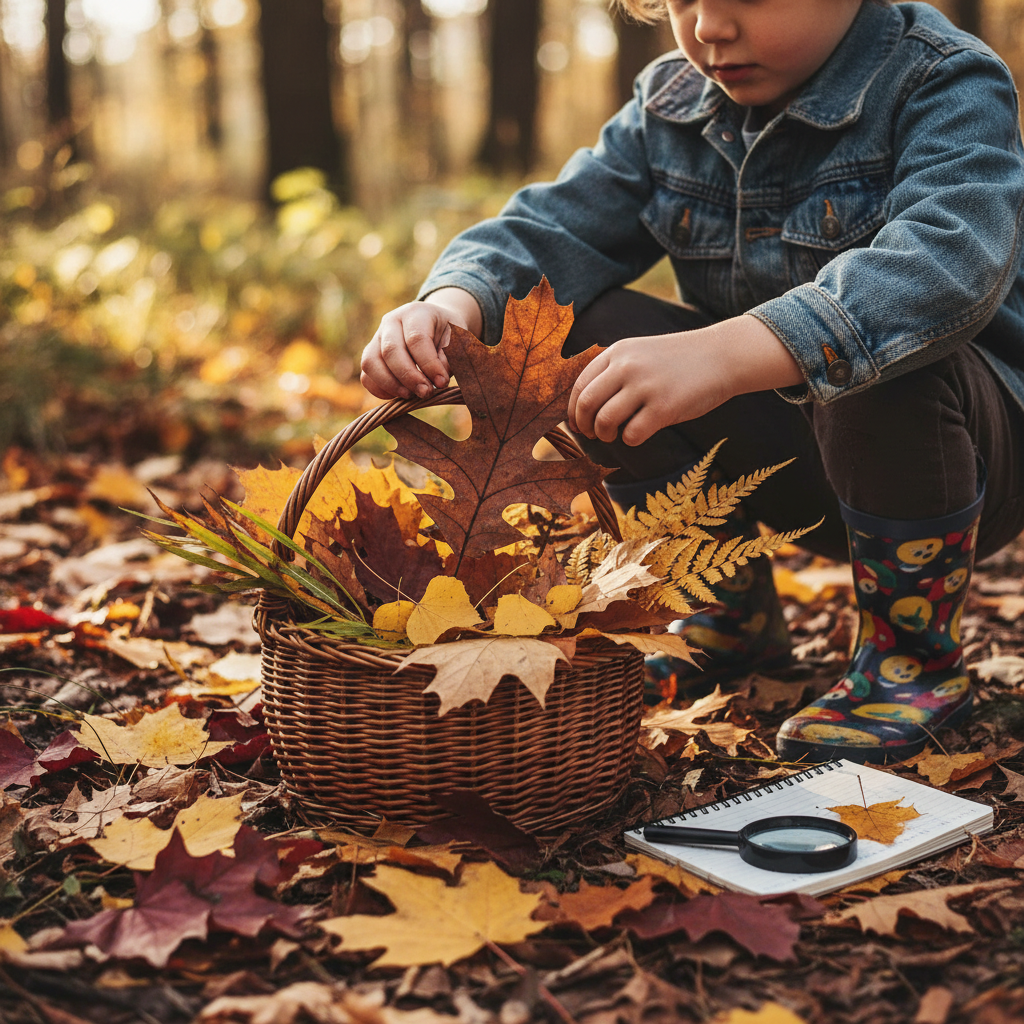
Analogy: Think of data like leaves in a forest. Each leaf is different – some are big, some are small, some are green, some are yellow. If you collect a bunch of leaves, you're gathering data about the forest! You can then learn about the different kinds of trees that live there, or what season it is.
Why is Data Important?
Data is super important because it helps us understand things and make smart choices. It's like having a superpower!
- To understand: Data helps us learn new things. For example, by looking at data about rainfall, we can understand why some places have lots of green plants and others are deserts.
- To make decisions: Imagine you want to know if it's a good day for a picnic. You collect data: Is the sun shining? Are there dark clouds? Is it windy? This data helps you decide if you should bring a blanket or an umbrella! It's like being a weather reporter for yourself.
How Do We Get Data? (Collecting Data)
Being a data detective means you need to know how to collect your clues! Here are some common ways:
- Observing: This means looking closely and noticing things. For example, you can observe how many birds visit your bird feeder in an hour.
- Asking Questions: You can ask people questions! This is called a survey. For example, you could ask all your friends, "What's your favorite ice cream flavor?"
- Measuring: You can use tools like rulers, scales, or stopwatches. For example, you can measure how tall a plant grows each week, or how long it takes to run across the playground.
Analogy: Collecting data is like gathering all your favorite toys. You might gather soft toys, building blocks, and art supplies. Each toy is a piece of data, and by gathering them, you know what you have to play with!
Making Sense of Data: Organizing Our Clues
Once you've collected a lot of data, it can look like a big messy pile, just like a pile of toys! To understand it better, we need to organize it. Organizing data helps us see patterns and answer questions easily.
- Lists: You can just write down everything you find in a list.
- Tally Marks: These are quick marks (like four lines and then one across) to count how many of something you have.
- Simple Tables: You can put data into boxes, with rows and columns.
- Picture Graphs (Pictographs): These use pictures to show how many of something there are. Each picture might stand for one item.
Analogy: Organizing data is like putting your toys away in different labeled boxes. All the building blocks go in one box, all the art supplies in another, and all the soft toys in a third. This makes them easy to find, count, and understand exactly what you have!
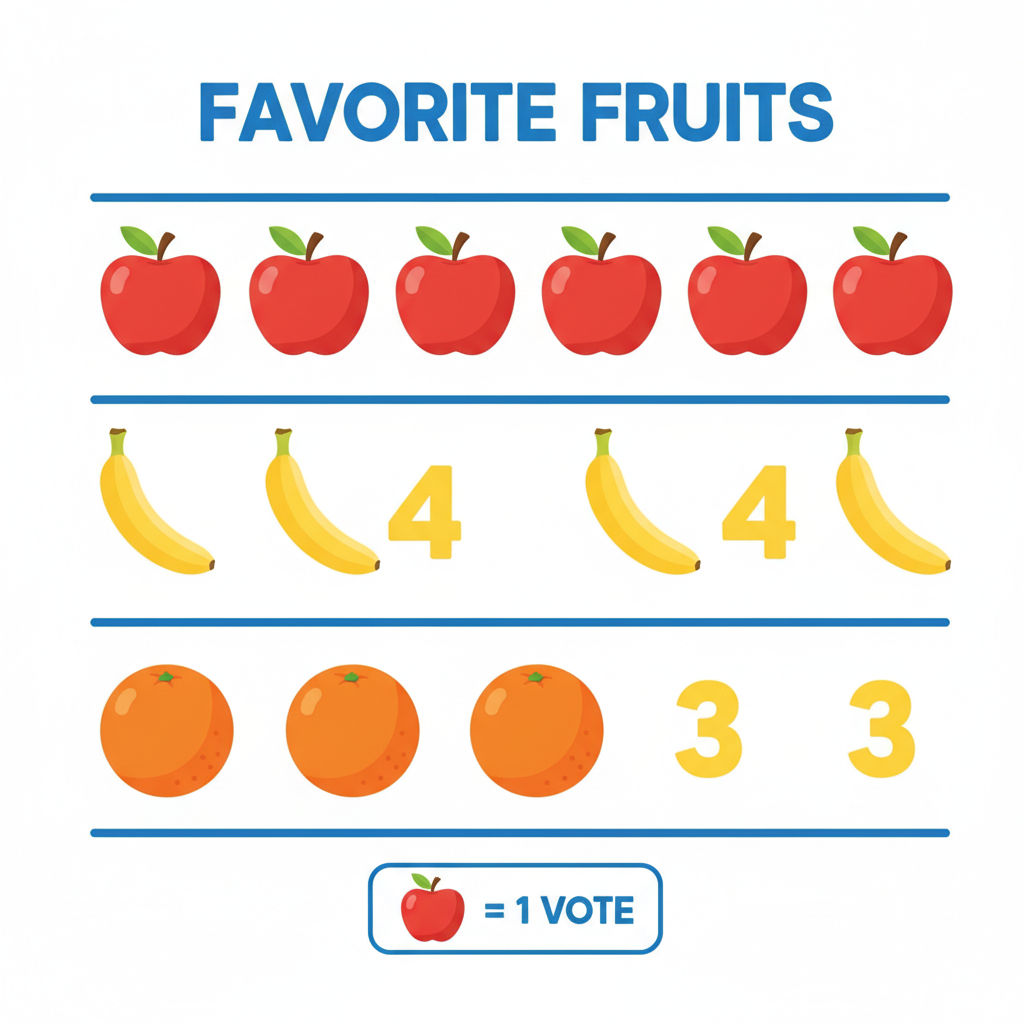 ⚠️ This picture may have spelling mistakes. Trust the words in the lesson.
Reading Data: What Do Our Clues Tell Us?
Once your data is organized, you can easily read it and find answers! For example, if you organized data about your friends' favorite ice cream flavors into a picture graph, you could quickly see:
- Which flavor is the most popular?
- Which flavor is the least popular?
- How many more friends like chocolate than vanilla?
Two Kinds of Data (for Super Detectives!)
Even though data can be words, numbers, or pictures, we can think about it in two main ways for now:
- Number Data: This is data that tells you "how many" or "how much." It's always a number.
- Examples: The number of red apples, your height in inches, how many minutes it takes to eat breakfast.
- Analogy: Think of these like the numbers on a scoreboard in a game. They tell you exactly how many points each team has.
- Category Data (or Label Data): This is data that tells you "what kind" or "which one." It often uses words or labels.
- Examples: Your favorite color (red), the type of animal (dog), the kind of sport you play (soccer).
- Analogy: These are like the names on a team jersey. They tell you who or what it is, not how many.
You Are a Data Detective!
Congratulations, you are now an official Data Detective! Data is a powerful tool that helps us learn, understand, and make smart decisions every single day. Keep observing, keep asking questions, and keep collecting those clues to unlock the secrets of our amazing world!
Keep learning, free
Create a free Syllabax account to unlock practice questions and games for this topic.
Visual Learning Enhanced! 🚀
To help you master this topic, we use Advanced Syllabax AI to generate detailed diagrams and visual models.
Note on Visuals: The AI sometimes makes spelling errors in image labels. Please refer to the lesson text for the correct terminology.