Pictographs: Reading & Making
Watch this topic in 60 seconds
Free preview · Lesson 1
Understanding Pictographs: Reading & Making
Welcome to the World of Pictographs: Reading & Making!
Have you ever seen a chart that uses little pictures instead of just plain numbers? That's a pictograph! Think of it like a visual story where emojis tell you how many of something there are. Instead of saying "There are 10 apples," a pictograph might show two little apple pictures, with a note saying "Each apple picture means 5 apples." It's a fun and easy way to understand information at a glance, especially when you want to compare different things.
What Exactly IS a Pictograph?
At its heart, a pictograph (or pictogram) is a type of chart that uses pictures or symbols to represent data. The word "picto" comes from "picture," and "graph" means a drawing or diagram that shows information. So, it's literally a "picture drawing" of data! Its main goal is to make numbers and comparisons super easy to see and understand, even for someone who just glances at it for a second. It turns boring numbers into engaging visuals.
The Superheroes of a Pictograph: Its Key Parts
Just like a good story needs characters, a setting, and a plot, a pictograph has several important parts that work together to tell its data story. If you understand these parts, you're halfway to becoming a pictograph pro!
1. The Title: The Story's Name!
Every good book or movie has a title that tells you what it's all about. A pictograph is no different! The title is usually at the top of the chart and clearly states what information the pictograph is showing. For example, a title might be "Favorite Fruits of 8th Graders" or "Number of Books Read This Month." It gives you the main idea instantly.
2. The Categories/Labels: The Different Chapters!
These are the specific things being counted or compared in your pictograph. They are usually listed down the side or across the bottom. If the title is "Favorite Fruits," the categories might be "Apples," "Bananas," "Oranges," and "Grapes." Each category is like a different chapter in your data story, focusing on one specific item.
3. The Symbols/Icons: The Visual Actors!
These are the actual little pictures or drawings that represent the data. If you're counting apples, the symbol might be a small apple drawing. If you're counting students, it might be a smiley face or a little stick figure. These symbols are the stars of the pictograph; they're what you count!
4. The Key (or Legend): The Secret Codebook! (MOST IMPORTANT!)
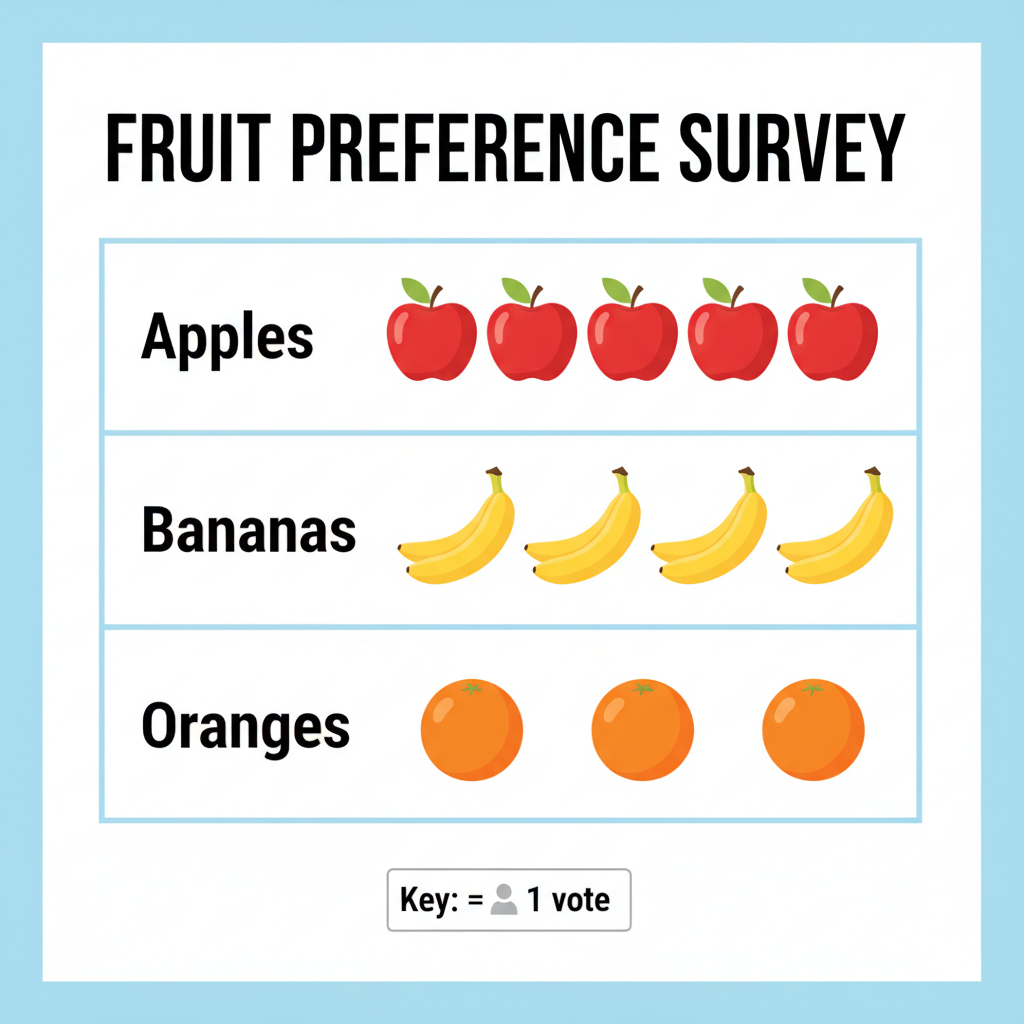
This is arguably the single most crucial part of any pictograph! The key (sometimes called a legend) is a small box or statement, usually at the bottom or side of the chart, that tells you what each symbol (or part of a symbol) stands for. It's like a secret codebook for your pictograph. Without the key, the symbols mean nothing! If the key says " = 5 apples," then every time you see that apple symbol, you know it means 5 actual apples. If you see half an apple symbol, it would mean half of 5, which is 2.5 apples! Always, always, ALWAYS read the key first!
 Reading a Pictograph: Becoming a Data Detective!
Now that you know the parts, let's put on our detective hats and learn how to read a pictograph step-by-step:
Step 1: Read the Title
Start by understanding what the entire pictograph is about. What story is it trying to tell?
Step 2: Unlock the Secret with the Key!
This is your most important clue! Find the key and understand exactly what one symbol (or a fraction of a symbol) represents. For example, if the key says " = 10 books," you know that every book picture counts as 10 real books.
Step 3: Count and Calculate for Each Category
Go through each category. Count all the full symbols first. Then, look for any partial symbols (like half a symbol) and figure out what they represent based on the key. Multiply the number of symbols by the value from the key. For example, if there are 3 full book symbols and the key says " ⚠️ This picture may have spelling mistakes. Trust the words in the lesson. = 10 books," then that category has 3 * 10 = 30 books.
Step 4: Compare and Interpret
Once you've calculated the total for each category, you can answer questions! Which category has the most? Which has the least? What's the difference between two categories? What's the total number of items across all categories? This is where you make sense of the data story.
Making Your Own Pictograph: Becoming a Data Artist!
Creating a pictograph is like painting a picture with data! Here's how you can design your own:
Step 1: Gather Your Data
First, decide what information you want to show and collect the numbers. For example, you might survey your classmates about their favorite colors: Red: 15, Blue: 20, Green: 10, Yellow: 5.
Step 2: Choose a Catchy Title
Give your pictograph a clear and descriptive title, like "Favorite Colors in Ms. Smith's 8th Grade Class."
Step 3: Pick a Perfect Symbol
Choose a simple picture that relates to your data. If you're showing favorite colors, maybe a small paintbrush, a star, or a colored circle. Make sure it's easy to draw and, ideally, easy to divide into halves or quarters if your data might require it.
Step 4: Design Your Key (The Tricky Part!)
This is where many people get stuck, but it's crucial! You need to decide how many items (students, books, cars, etc.) one of your chosen symbols will represent. This is called the 'scale' of your pictograph.
- Analogy: Building a Model Car. If you're building a model car, you don't use real car parts. You use scaled-down versions. The scale tells you how much smaller your model is compared to the real thing (e.g., 1 inch on the model = 1 foot on the real car). For a pictograph, your key tells you how many real items each symbol represents.
- How to Choose the Key: Look at your data (e.g., 15, 20, 10, 5). Find the smallest number and the largest number. Try to pick a key that is a common factor of most or all your numbers. For our example (15, 20, 10, 5), a key like "1 paintbrush = 5 students" would work perfectly because all our numbers (5, 10, 15, 20) are multiples of 5. If your numbers were 7, 14, 21, you might choose "1 symbol = 7 items." Avoid keys that would force you to draw tiny, confusing fractions of symbols if possible.
Step 5: Draw Your Symbols!
Now, based on your key, draw the correct number of symbols for each category. For our favorite colors example with "1 paintbrush = 5 students":
- Red (15 students): Draw 3 paintbrushes (15 / 5 = 3)
- Blue (20 students): Draw 4 paintbrushes (20 / 5 = 4)
- Green (10 students): Draw 2 paintbrushes (10 / 5 = 2)
- Yellow (5 students): Draw 1 paintbrush (5 / 5 = 1)
Step 6: Add Labels and Organize
Make sure all your categories are clearly labeled, and don't forget to display your key prominently so everyone can understand your amazing data story!
Why Do We Use Pictographs? The Power of Pictures!
- Quick Understanding: Pictures are processed faster by our brains than just numbers. You can see patterns and comparisons instantly.
- Engaging and Fun: They're more visually appealing and can make data less intimidating, especially for a younger audience.
- Simple Comparisons: Great for showing which category has more or less at a glance.
When Should We NOT Use Pictographs? (Their Weaknesses)
- Less Precise: If you need exact numbers, pictographs can be tricky, especially with partial symbols. Is that a half or a third of a symbol?
- Large Numbers: If you have huge numbers, you'd need an extremely large scale for your key (e.g., 1 symbol = 1,000,000 items), which can still make it hard to visualize smaller differences.
- Potential for Misleading: If symbols are drawn inconsistently (some bigger than others) or the key isn't clear, a pictograph can accidentally (or intentionally!) mislead the reader.
Conclusion: Your Pictograph Journey!
You've now learned the ins and outs of pictographs! From understanding their essential parts like the crucial 'key' to reading and even creating your own visual data stories. Remember, pictographs are powerful tools for making data clear and engaging, but always pay attention to the key to unlock their true meaning. Keep practicing, and you'll be a master data artist in no time!
Keep learning, free
Create a free Syllabax account to unlock practice questions and games for this topic.
Visual Learning Enhanced! 🚀
To help you master this topic, we use Advanced Syllabax AI to generate detailed diagrams and visual models.
Note on Visuals: The AI sometimes makes spelling errors in image labels. Please refer to the lesson text for the correct terminology.