Populations vs. Samples
Watch this topic in 60 seconds
Free preview · Lesson 1
Understanding Populations vs. Samples
Understanding Populations vs. Samples: The Building Blocks of Data
Welcome to our exploration of a fundamental concept in statistics and data analysis: the difference between a population and a sample. Think of it like being a detective. You want to understand something about a large group of people or things, but you can't possibly gather information from every single one. So, you need to figure out how to get a good idea by looking at just a few. This is where populations and samples come in!
What is a Population?
In statistics, a population is the entire group that you want to study or draw conclusions about. It's the complete set of individuals, items, or data points that share a common characteristic. Imagine you're interested in knowing the average height of all teenagers in your country. In this case, every single teenager in your country is the population.
Let's break this down with some analogies:
- The Entire School Yearbook: If you want to know the average age of all students in a high school, the population is every student listed in that year's yearbook.
- All the Fish in a Lake: If a biologist wants to understand the average weight of a specific type of fish in a large lake, the population is all of those fish in that lake.
- Every Vote in an Election: When election pollsters want to predict the outcome of a presidential election, the population is every single person who will cast a vote.
- All the Products on an Assembly Line: A quality control manager checking the durability of light bulbs wants to test every single light bulb produced by a factory on a given day. That entire batch is the population.
The key thing about a population is that it's the group you are ultimately interested in. However, studying the entire population is often:
- Impractical: It might be too difficult or time-consuming to reach everyone.
- Impossible: Sometimes the population doesn't even exist yet (like future customers).
- Too Expensive: Gathering data from everyone can cost a lot of money.
- Destructive: In some cases, testing the item means destroying it (like testing a car's crash safety).
What is a Sample?
Since studying the entire population is often not feasible, we use a sample. A sample is a smaller, manageable group selected from the population. The goal is for the sample to be representative of the population, meaning it accurately reflects the characteristics of the larger group. If we go back to our teenager height example, a sample would be selecting, say, 1000 teenagers from different parts of the country and measuring their heights.
Here are some analogies for samples:
- A Handful of Grapes: Imagine you want to know if a whole bunch of grapes is sweet. You don't eat every single grape. You pick a few (a sample) from different parts of the bunch to taste.
- A Tasting Spoon at an Ice Cream Shop: When you want to try a new ice cream flavor, you get a small spoonful (a sample) to decide if you like the whole tub.
- A Survey of Random Voters: Instead of asking every single voter, pollsters interview a few hundred or a thousand randomly chosen voters to get an idea of the election outcome.
- Testing a Few Bulbs: The quality control manager might take 50 light bulbs from the day's production (a sample) and test them to see if they meet standards.
A good sample is like a miniature version of the population. It should have similar characteristics, proportions, and variations. If your sample isn't representative, your conclusions about the population might be wrong. This is called bias.
Example of a Biased Sample: If you wanted to know the average commute time for all workers in a city and only surveyed people who work from home, your sample would be heavily biased, and your results wouldn't reflect the reality for most workers.
Why Do We Use Samples?
As mentioned before, samples are used primarily because:
- Feasibility: It's much easier and faster to collect data from a small group.
- Cost-Effectiveness: It costs significantly less to survey or test a sample than an entire population.
- Accuracy (when done right): A well-chosen sample can provide very accurate insights into the population.
- Efficiency: It allows researchers to get results in a timely manner.
Population vs. Sample: The Key Differences Summarized
Let's put it side-by-side:
| Feature | Population | Sample |
|---|---|---|
| Definition | The entire group of interest. | A subset or part of the population. |
| Size | Usually large, can be very large or even infinite. | Smaller and manageable. |
| Data Collection | Often difficult, expensive, or impossible. Involves a census. | Easier, cheaper, and faster. |
| Goal | To understand characteristics of the whole group. | To make inferences or generalizations about the population. |
| Example (Height of 10th Graders) | All 10th graders in the world. | 100 randomly selected 10th graders from different schools. |
It's crucial to distinguish between these two terms because the methods used to analyze data and the conclusions drawn depend heavily on whether you are describing a population or making inferences from a sample. When you have data from an entire population, you are performing descriptive statistics for that population. When you use data from a sample to talk about a population, you are using inferential statistics.
Think of it this way:
Imagine you have a giant bowl of colorful candies.
The Population: All the candies in the entire giant bowl.
The Sample: A handful of candies you scoop out from the bowl.
If you want to know the proportion of red candies in the whole bowl, you would ideally count every single candy (the population). But that's a lot of work! So, you take a handful (the sample) and count the red candies in that handful. Based on your handful, you then try to guess how many red candies are in the whole giant bowl. The better your handful represents the whole bowl (e.g., you didn't just grab from the top where all the red ones might be, but mixed them up), the better your guess will be.
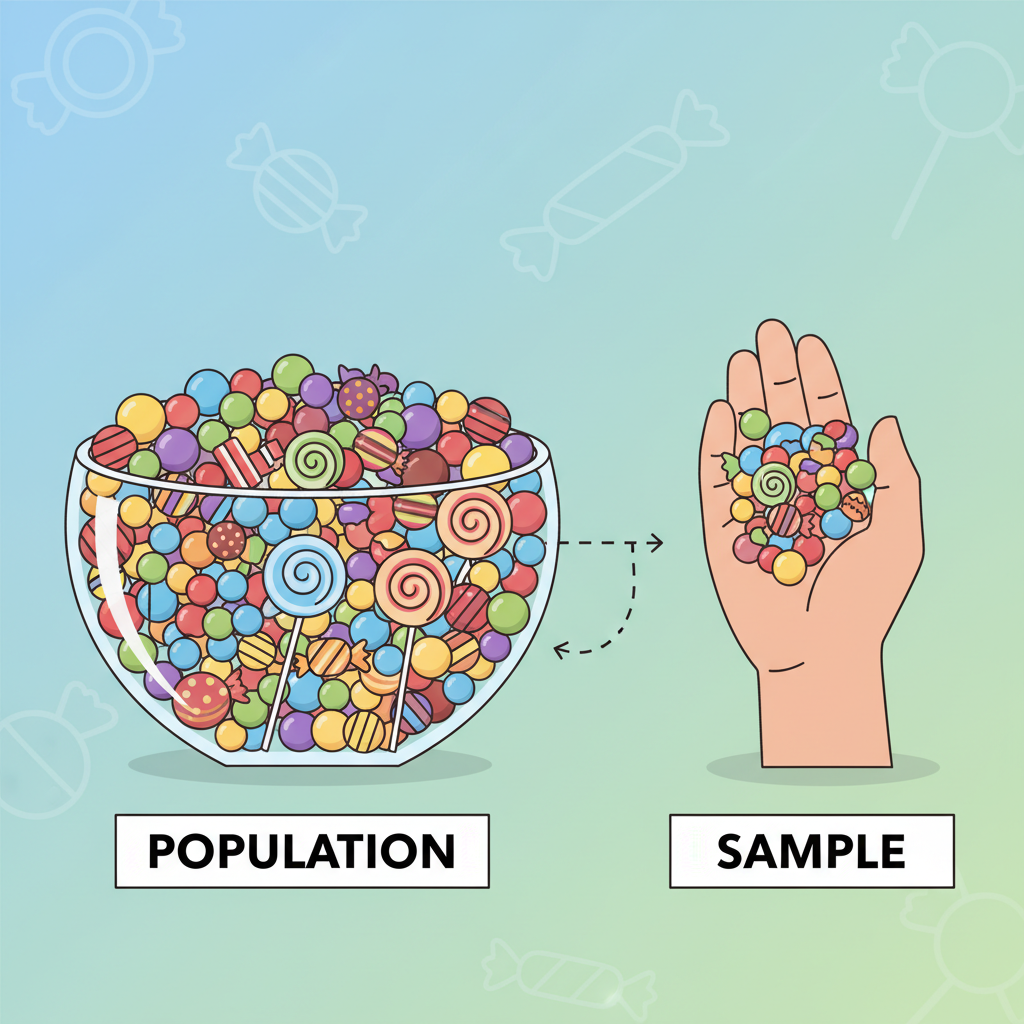 ⚠️ This picture may have spelling mistakes. Trust the words in the lesson.
In summary, a population is everything you want to know about, and a sample is the smaller group you actually collect data from to learn about that 'everything'. The magic of statistics is using that small sample to make educated guesses about the big population!
Key Concepts Recap
- Population: The complete set of all individuals or items you are interested in studying.
- Sample: A smaller, representative subset of the population from which data is collected.
- Representativeness: A good sample accurately reflects the characteristics of the population.
- Bias: Occurs when a sample does not accurately represent the population, leading to skewed conclusions.
Understanding this distinction is your first, vital step in comprehending how data can be used to make sense of the world around us.
Keep learning, free
Create a free Syllabax account to unlock practice questions and games for this topic.
Visual Learning Enhanced! 🚀
To help you master this topic, we use Advanced Syllabax AI to generate detailed diagrams and visual models.
Note on Visuals: The AI sometimes makes spelling errors in image labels. Please refer to the lesson text for the correct terminology.