Choosing the Best Graph
Watch this topic in 60 seconds
Free preview · Lesson 1
Understanding Choosing the Best Graph
Choosing the Best Graph: A Storyteller's Guide for 3rd Graders!
Hey there, young data detectives! Have you ever tried to tell a story using numbers or information? It can be tricky, right? That's where graphs come in! Think of graphs like different kinds of storybooks for your numbers. Just like you wouldn't use a picture book to learn about rocket science, you wouldn't use every graph for every kind of information. Choosing the best graph is like picking the perfect tool for a job!
Imagine your dad trying to hammer a nail with a screwdriver. It wouldn't work very well, would it? He needs a hammer! In the same way, we need to pick the right graph to show our information clearly and make it easy to understand. Let's explore our graph toolbox!
Tool #1: The Tally Chart – Your Quick Counter!
A Tally Chart is super simple and quick, like a scratchpad for counting. When you want to count things as they happen, like how many people in your class choose apple, banana, or orange for snack, a tally chart is your best friend. You just make little lines!
- How it works: You make one vertical line ( | ) for each item you count. When you get to the fifth item, you draw a diagonal line across the first four (
| | | |). This makes it easy to count by fives! - When to use it: When you are collecting data on the spot. It's great for quick surveys, counting votes, or keeping track of things as they happen.
- Analogy: Think of a tally chart like keeping score in a game of tag. Every time someone gets tagged, you make a quick mark. It's fast and easy to keep up!
Tool #2: The Pictograph – Storytelling with Pictures!
A Pictograph is a really fun way to show information because it uses pictures or symbols! Each picture stands for a certain number of things. It's like drawing little emojis to tell your number story.
- How it works: You choose a picture that relates to your data (like a little star for students or a little apple for apples). Then, you decide what each picture will represent. Maybe one apple picture means 5 actual apples. You always need a 'key' to explain what each picture means!
- When to use it: When you want to show how many of something there are, and you want it to look fun and visual. It’s good for comparing amounts using simple, easy-to-understand pictures.
- Analogy: Imagine you're making a chore chart, and for every chore you complete, you get a sticker. If one sticker means you get to watch 10 minutes of TV, that's like a pictograph! The stickers tell you how many TV minutes you've earned.
Tool #3: The Bar Graph – The Tower Builder!
A Bar Graph uses bars (like tall buildings!) to show and compare amounts. The longer or taller the bar, the more of that thing there is. It's excellent for seeing differences between groups at a glance.
- How it works: You draw rectangles (bars) up to a certain height or length to show how many items are in each category. One side usually lists the categories (like 'Favorite Color' or 'Pet Type'), and the other side has numbers to show the amount.
- When to use it: When you want to compare different groups or categories. For example, comparing how many students like red, blue, or green as their favorite color. It helps you quickly see which group has the most or the least.
- Analogy: Think of a bar graph like building towers with blocks. If you build a tall red tower, a medium blue tower, and a small green tower, you can easily see which color has the most blocks and which has the least.
Tool #4: The Line Plot – The Number Line X-Marks-the-Spot!
A Line Plot is a simple graph that uses a number line and X's (or dots) to show how often something happens. It's perfect for when you're measuring things, like shoe sizes or the number of books read.
- How it works: You draw a number line (like the one you use in math class). Then, for each piece of data, you put an 'X' above the correct number on the line. If two students have the same shoe size, you put two 'X's stacked one on top of the other.
- When to use it: When you want to show how often certain values or measurements occur. It's great for showing the spread of data along a number line.
- Analogy: Imagine you have a bunch of different length pencils. You line them up by length, and for each pencil, you put an 'X' above its length on a ruler. If you have three pencils that are 6 inches long, you'd stack three X's above the number 6 on your ruler!
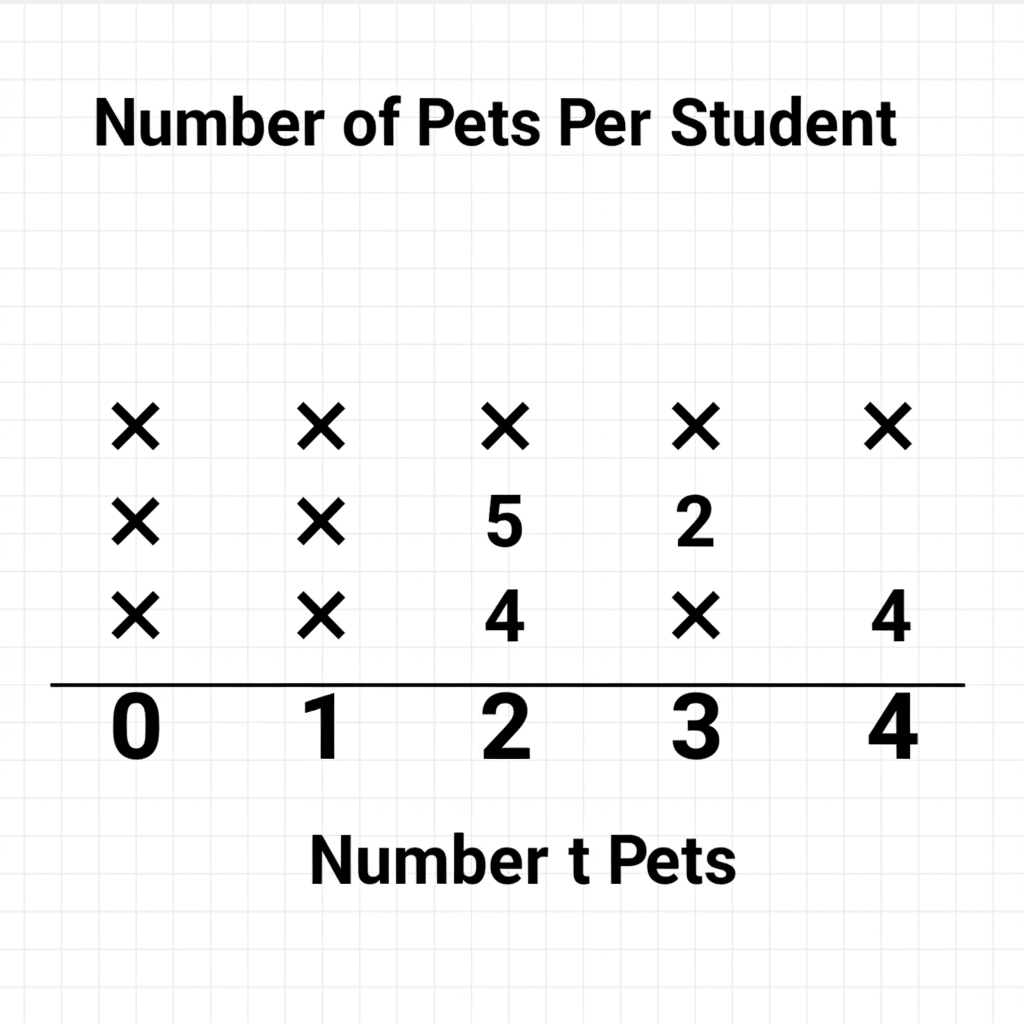 ⚠️ This picture may have spelling mistakes. Trust the words in the lesson.
Choosing Your Super Graph: Which Tool for Which Job?
Now that you know your tools, how do you pick the best one? Ask yourself these questions:
- Am I just quickly counting things as they happen? Use a Tally Chart.
- Do I want to use fun pictures to show 'how many' and make it easy to see differences? Use a Pictograph.
- Do I want to compare different groups or categories to see which has the most or least? Use a Bar Graph.
- Do I want to show how often something appears along a number line (like measurements or counts of specific items)? Use a Line Plot.
Remember, each graph tells a slightly different story, even with the same numbers. The best graph is the one that tells your number story in the clearest, most helpful way!
Let's Recap!
- Tally Chart: Quick counting on the spot.
- Pictograph: Using pictures to show amounts.
- Bar Graph: Comparing different categories with bars.
- Line Plot: Showing how often things happen along a number line.
Practice makes perfect! The more you work with different kinds of information, the better you'll become at choosing the perfect graph to be your number storyteller!
Keep learning, free
Create a free Syllabax account to unlock practice questions and games for this topic.
Visual Learning Enhanced! 🚀
To help you master this topic, we use Advanced Syllabax AI to generate detailed diagrams and visual models.
Note on Visuals: The AI sometimes makes spelling errors in image labels. Please refer to the lesson text for the correct terminology.