Misleading Statistics & Graphs
Watch this topic in 60 seconds
Free preview · Lesson 1
Understanding Misleading Statistics & Graphs
Understanding Misleading Statistics & Graphs: Don't Get Fooled!
Hey 9th graders! Have you ever heard someone say, "8 out of 10 dentists recommend this toothpaste," or seen a graph that makes one product look amazingly better than another? Statistics and graphs are powerful tools. They help us understand the world around us, from how many students prefer chocolate milk to how fast global temperatures are changing. But just like any tool, they can be used poorly, or even intentionally misused, to trick us or make a point seem stronger than it really is. This lesson is all about becoming a super-sleuth, able to spot when numbers and pictures are trying to pull a fast one on you!
What Are Statistics? (A Quick Refresher)
Think of statistics as a way to gather, organize, and understand data – which is just a fancy word for facts or pieces of information. For example, if you wanted to know the average height of students in your class, you'd collect everyone's height (data), then do some math to find the average (statistics). Simple, right?
When Statistics Go Rogue: Spotting the Shenanigans
Sometimes, the way statistics are collected or presented can be misleading. It's like someone trying to convince you that their team is the best by only showing you their winning games, not the ones they lost. Let's look at some common ways statistics can be sneaky:
1. Biased Samples: The Unfair Headcount
Imagine you want to know if students at your school like broccoli. If you only ask your friends who you know love broccoli, you're not going to get a very accurate picture of the whole school, are you? This is called a biased sample.
- Definition: A biased sample happens when the group of people or things you study (your sample) isn't truly random or representative of the larger group you want to draw conclusions about. It's like trying to guess the flavor of an entire box of chocolates by only tasting the chocolate ones.
- Analogy: If a survey about favorite video games is only given to people leaving a specific gaming convention, the results will be biased towards those particular games, not necessarily reflecting what all teenagers like. They didn't ask a fair mix of gamers and non-gamers.
2. Small Sample Size: Not Enough Voices
Let's say a new movie just came out, and you ask three of your friends if it's good. They all say "yes!" Does that mean everyone will love the movie? Probably not. Three people aren't enough to speak for thousands!
- Definition: A small sample size means you haven't collected enough data from enough people or items to make a reliable conclusion. It's too easy for a few unusual cases to skew the results.
- Analogy: If you try to decide if a new restaurant is good after only one dish, you might be missing out on their best (or worst) items. You need to try more to get a real sense.
3. Cherry-Picking Data: The "Best Parts Only" Show
Marketers love this one! They might say, "Our product improved skin in 9 out of 10 users!" But what if they tested 100 people, and 90 showed no improvement, while 9 did, and 1 got worse? If they only highlight the 9 successes and ignore the rest, that's cherry-picking.
- Definition: Cherry-picking involves selecting only the data that supports your argument while ignoring data that contradicts it. It presents an incomplete and skewed picture.
- Analogy: Imagine you're showing your parents your report card, but you only show them your 'A' grades and hide the 'C's and 'D's. You're cherry-picking the good results!
4. Loaded Questions: Guiding Your Answer
Consider these two questions: "Do you support the school's initiative to improve outdated facilities by investing in modern technology?" vs. "Do you believe the school should waste taxpayer money on unnecessary gadgets?" The first sounds positive, the second negative. The wording guides your answer.
- Definition: A loaded question is phrased in a way that suggests a particular answer or contains an unproven assumption, making it difficult to answer honestly without appearing to agree with the assumption.
- Analogy: Asking "Have you stopped cheating on tests yet?" assumes the person was cheating in the first place, no matter how they answer!
5. Correlation vs. Causation: The Chicken and the Egg Dilemma
Just because two things happen at the same time or seem to be related doesn't mean one causes the other. For example, ice cream sales and shark attacks both go up in the summer. Does eating ice cream cause shark attacks? Of course not! The common factor is summer weather.
- Definition: Correlation means two things tend to happen together. Causation means one thing directly causes another to happen. Confusing the two is a common way to mislead.
- Analogy: Every time the school bell rings (correlation), students leave class. But the bell doesn't cause them to leave; the end of the lesson (which the bell signals) is the cause, and students leave because they are instructed to.
Graphs That Lie: Visual Deception
Numbers can be twisted, but so can pictures! Graphs are supposed to make data easier to understand, but they can also be designed to exaggerate differences or hide important information. Let's unravel some visual tricks:
1. Truncated Y-Axis: The "Zoomed-In" Effect
This is one of the most common graph tricks. Imagine a graph showing two brands of juice, Brand A and Brand B, and it looks like Brand A sold WAY more. But if you look closely at the vertical axis (the Y-axis), it might not start at zero. It might start at, say, 90 units sold, even though sales are counted from 0. This makes small differences look enormous.
- Definition: A truncated Y-axis (or non-zero baseline) cuts off the bottom part of the vertical axis, making differences between data points appear much larger than they actually are.
- Analogy: It's like using a ruler that starts at 5 inches instead of 0. If you measure a pencil that's 6 inches long, it would look like it's only 1 inch long on that ruler! This trick makes small changes seem dramatic.
2. Inconsistent Intervals: Uneven Steps
Imagine a timeline of historical events where the first gap is 10 years, the next is 50 years, and the next is 2 years, but they all look like the same distance on the graph. This messes with your sense of scale.
- Definition: Inconsistent intervals mean the spaces between the numbers on an axis (like years, or amounts) are not equal, making trends appear faster or slower than they truly are.
- Analogy: If you're running a race, and some parts of the track are 10 meters long while others are 100 meters, but they all look the same, you wouldn't know how far you've really run!
3. Scale Distortion with Pictographs: The Growing Image
A pictograph uses images to represent data. If a graph shows that "Company B makes twice as many cars as Company A," they might show a car for Company B that is twice as tall as the car for Company A. But if it's twice as tall, it's also twice as wide, making it four times the area (2x2=4), and thus making it look like Company B makes four times as many cars!
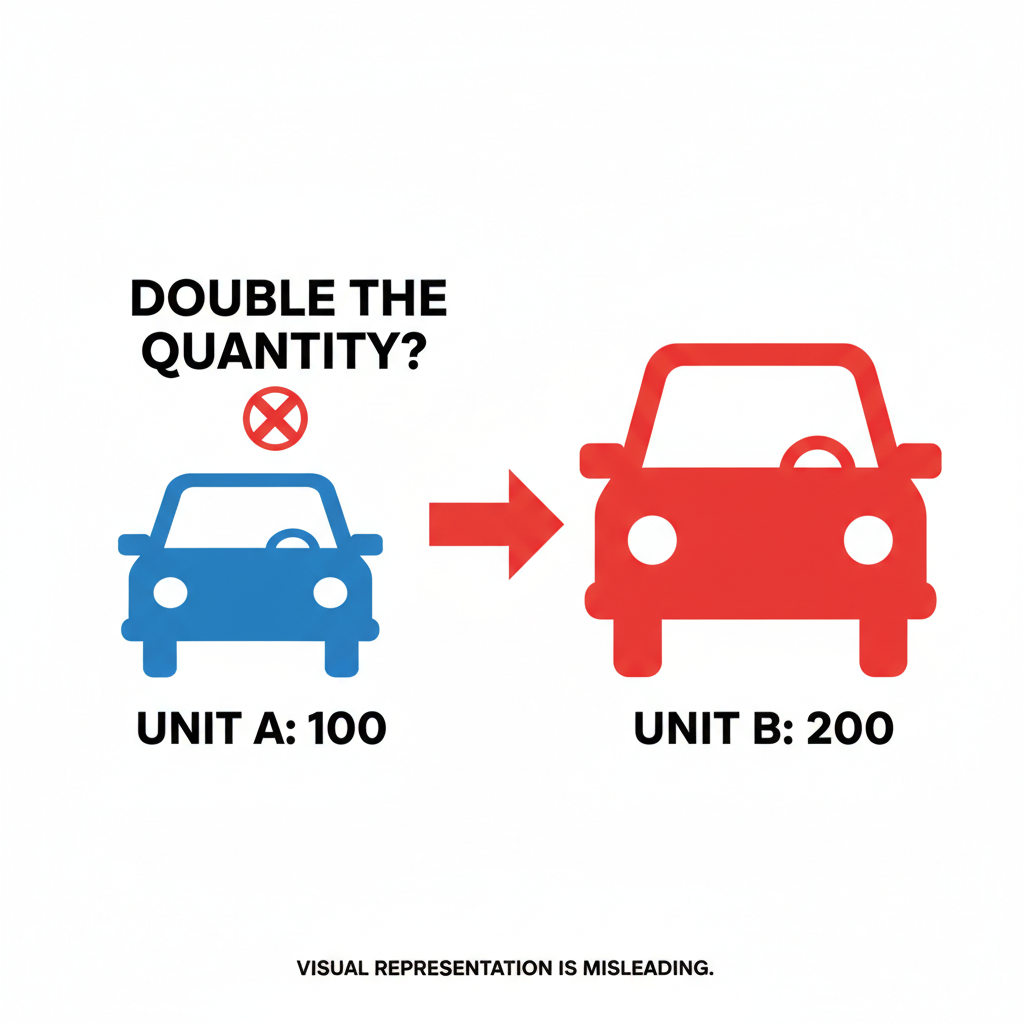
- Definition: When using pictographs, increasing the height and width of an image proportionally to represent a larger quantity can misleadingly suggest an even greater increase (e.g., doubling the height and width makes the area four times larger).
- Analogy: If you wanted to show that you doubled the number of apples, you shouldn't draw an apple that's twice as big in all directions. You should draw two apples of the original size!
4. Missing Baseline/Context: The Half-Told Story
Sometimes, a graph might only show a small slice of data without giving you the full picture. If a graph shows unemployment going up, but doesn't show it for the last 50 years where it was much higher, you're missing important context.
- Definition: Omitting the full range of data, a baseline (like starting at zero), or comparative data can hide the true significance or insignificance of the trend being shown.
- Analogy: It's like judging a movie after only seeing the last 10 minutes. You have no idea what happened before or why things are the way they are.
Why Does This Matter? Becoming a Critical Thinker!
Understanding misleading statistics and graphs isn't just about math; it's about being smart consumers of information. We're bombarded with data every day – in news articles, advertisements, social media, and even school projects. If you can spot these tricks, you'll be better equipped to:
- Make informed decisions (like which product to buy or who to vote for).
- Understand the real story behind headlines.
- Avoid being manipulated by others.
- Form your own opinions based on solid evidence, not sneaky numbers.
So, next time you see a bold claim backed by a chart, pause for a moment. Ask yourself: "Where did this data come from? Who paid for this study? What's not being shown? Does the graph look fair?" Your critical thinking skills are your best defense!
Keep learning, free
Create a free Syllabax account to unlock practice questions and games for this topic.
Visual Learning Enhanced! 🚀
To help you master this topic, we use Advanced Syllabax AI to generate detailed diagrams and visual models.
Note on Visuals: The AI sometimes makes spelling errors in image labels. Please refer to the lesson text for the correct terminology.