Observing and Recording Data
Watch this topic in 60 seconds
Free preview · Lesson 1
Understanding Observing and Recording Data
Observing and Recording Data: Becoming a Super Scientist!
Hello, young scientists! Have you ever wondered how we learn about the world around us? How do we know what animals eat, how plants grow, or even what the weather will be like tomorrow? It all starts with two very important skills: **observing** and **recording data**.
What is "Observing"?
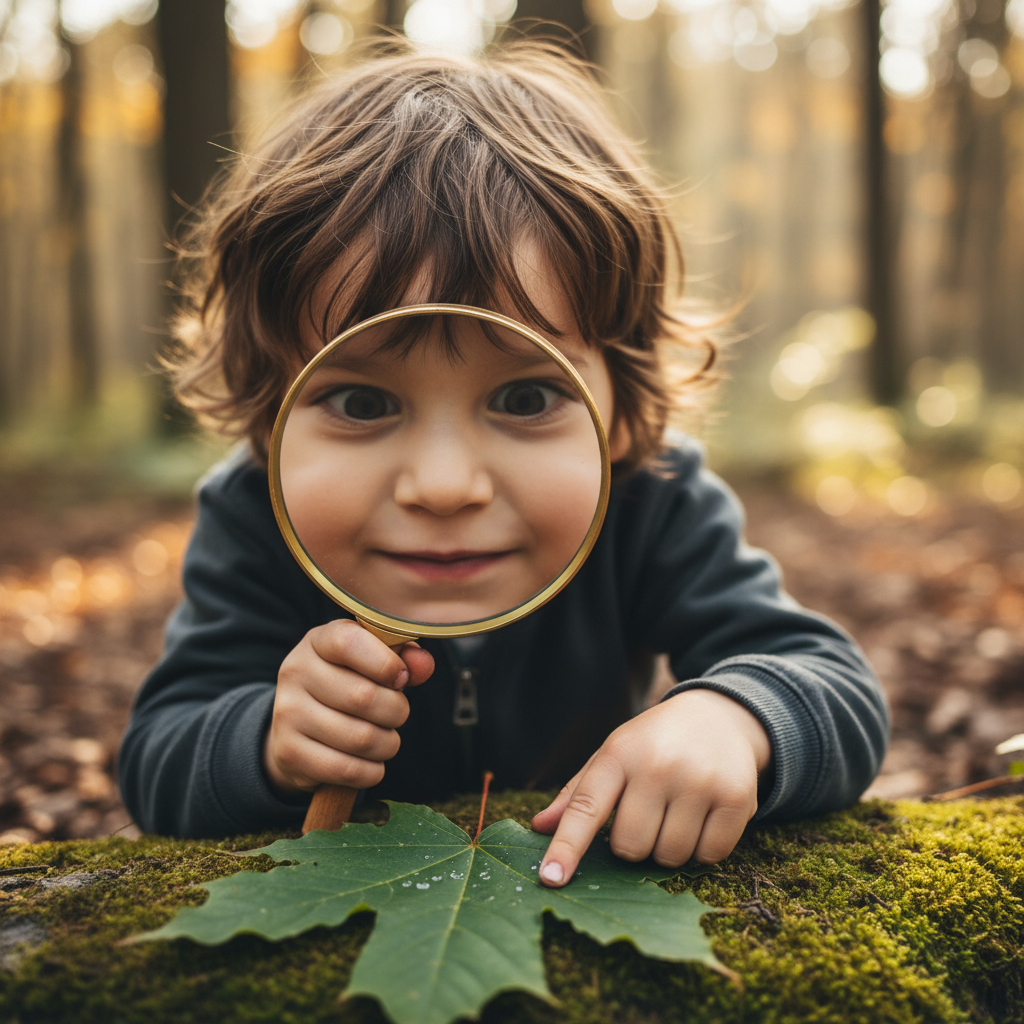
Imagine you are a super-smart detective trying to solve a mystery! How would you figure out what happened? You would use your eyes to look for clues, your ears to listen for sounds, and maybe even your hands to feel different textures. This is exactly what observing is!
Observing means using all five of your senses – your eyes (to see), your ears (to hear), your nose (to smell), your hands (to touch), and sometimes even your tongue (to taste, but we mostly use this for food, not science experiments unless an adult says it's safe!) – to carefully notice what is happening around you. When you observe, you're not just looking; you're really seeing. You're not just hearing; you're really listening.
Think of it like this: If you look at a flower, you might just see 'a flower'. But if you **observe** a flower, you might notice its bright red petals, how its leaves are dark green, the tiny yellow pollen inside, and maybe even a little bee buzzing around it! You're paying close attention to all the details.
For example, if you observe the sky, you might notice if it's sunny, cloudy, or rainy. You might see different shapes of clouds or the bright colors of a sunset. Every time you use your senses to understand something better, you are observing!
Why is Observing Important?
Observing carefully helps us understand things better. It's the first step to learning new information. A scientist can't figure out why something happens unless they first observe what is happening. It helps us ask questions, like, "Why is that leaf turning yellow?" or "What makes that bird sing that particular song?"
What is "Recording Data"?
Okay, so you've been a great detective and observed lots of cool things! Now, what happens if you forget what you saw, heard, or felt? This is where **recording data** comes in handy!
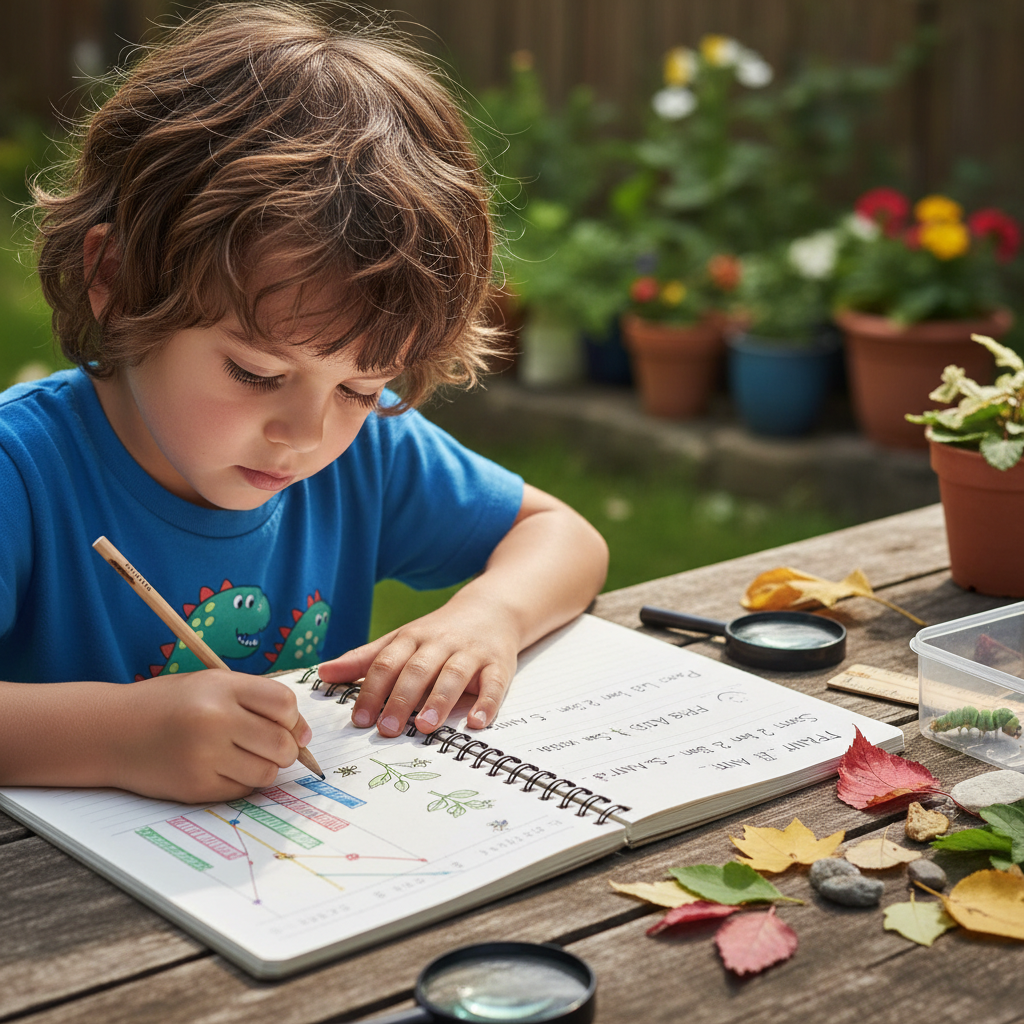
Recording data means writing down or drawing what you have observed. It's like keeping a special science diary! You wouldn't want to forget your awesome discoveries, right? Recording helps you remember, and it also helps you share your discoveries with others.
Imagine you observe a tiny caterpillar munching on a leaf every day. If you don't write down what you see, how will you remember how much it grew each day? Or when it started to build its cocoon? Recording helps you keep track of changes over time.
How Do We Record Data?
There are many easy and fun ways to record the data you collect:
-
Drawings and Pictures:
Sometimes, the best way to record an observation is to draw a picture! If you're observing a flower, you can draw it and label its parts: "red petal," "green stem." If you're observing clouds, you can draw their shapes. Make sure your drawing shows what you actually saw, not just what you think it should look like!
-
Words and Descriptions:
You can write down what you observe using words. For example, if you see a squirrel, you might write: "The squirrel has a bushy tail. It is collecting nuts. It moved very quickly." Use simple sentences to describe the details.
-
Tally Marks:
Tally marks are super helpful when you want to count how many of something you see. Imagine you're counting how many birds visit your bird feeder. Each time you see a bird, you make one line ( | ). When you get to five, you make a diagonal line across the first four (
||||). This makes it easy to count in groups of five!Example: If you saw 7 blue birds, you would make:
||||||Tally marks help us keep track of numbers without having to write out 'one, two, three...' every time.
-
Simple Charts and Tables:
Charts and tables are like organized boxes where you put your information. They help keep your data neat and easy to understand. For example, you could make a chart to record the weather each day:
Day Weather Temperature (warm/cool) Monday Sunny Warm Tuesday Cloudy Cool See how easy it is to compare the weather from different days with a chart?
Putting It All Together: A Plant Experiment!
Let's say you're growing a small bean plant. Here's how you'd observe and record:
- Observe: Every day, you look closely at your plant. What color are the leaves? How tall is it? Are there any new shoots? Is the soil wet or dry?
-
Record: You open your science notebook and write the date. Then you might:
- Draw: A picture of the plant, showing its current size and number of leaves.
- Write: "Today, the plant is 5 cm tall. It has 3 small leaves. The soil is a little dry."
- Measure: Use a ruler to measure its height and write down the number.
By doing this every day, you'll have a wonderful record of how your plant grows from a tiny seed to a big plant! You'll be able to see patterns and changes.
Why is Recording Data Important for Scientists?
Recording data is super important for scientists because:
- It helps them remember exactly what happened during an experiment or observation.
- It allows them to compare information over time.
- They can share their findings with other scientists around the world.
- It helps them find patterns and make new discoveries!
Just like a chef follows a recipe, a scientist follows their observations and recorded data to understand the world. By observing carefully and recording neatly, you are already thinking and acting like a real scientist!
Keep Practicing!
Now that you know about observing and recording, look around you! What can you observe in your classroom, your home, or outside? What can you record? The more you practice, the better you'll become at being a super scientist!
Keep learning, free
Create a free Syllabax account to unlock practice questions and games for this topic.
Visual Learning Enhanced! 🚀
To help you master this topic, we use Advanced Syllabax AI to generate detailed diagrams and visual models.
Note on Visuals: The AI sometimes makes spelling errors in image labels. Please refer to the lesson text for the correct terminology.