Reading Tally Charts
Watch this topic in 60 seconds
Free preview · Lesson 1
Understanding Reading Tally Charts
Hello, Young Mathematicians! Let's Explore Tally Charts!
Do you ever need to count things? Like how many friends are at a party, how many red apples are in a basket, or how many votes your favorite ice cream flavor got? Counting is super important! Sometimes, just counting on your fingers can get a little tricky when there are lots and lots of things. That's where a super-duper helpful tool called a Tally Chart comes in!
What are Tally Marks?
Before we learn about tally charts, let's learn about Tally Marks. Imagine you're drawing little lines to keep track of things. Each line stands for ONE thing. It's like giving each item its very own little sticker, but instead of a sticker, it's a quick line!
- If you see one bird, you draw one line: |
- If you see two birds, you draw two lines: ||
- If you see three birds, you draw three lines: |||
- If you see four birds, you draw four lines: ||||
The Magic Number 5: Bundles!
Now, what happens when you have lots of things, like six, seven, or even ten birds? Drawing lots and lots of single lines can get messy and hard to count quickly. So, smart people invented a special trick for the number 5!
When you get to the fifth item, you don't just draw another line next to the four. Instead, you draw a line that goes ACROSS the first four lines! It makes a neat little bundle. Like this:
|||| Then, for the fifth, you cross it: ⅇ or ⤊
This bundle of five looks a bit like a tiny fence with a slanted roof, or maybe like someone giving you a high-five with four fingers up and their thumb across! This bundle ALWAYS means 5. It's like having a special '5-pack' of tally marks.
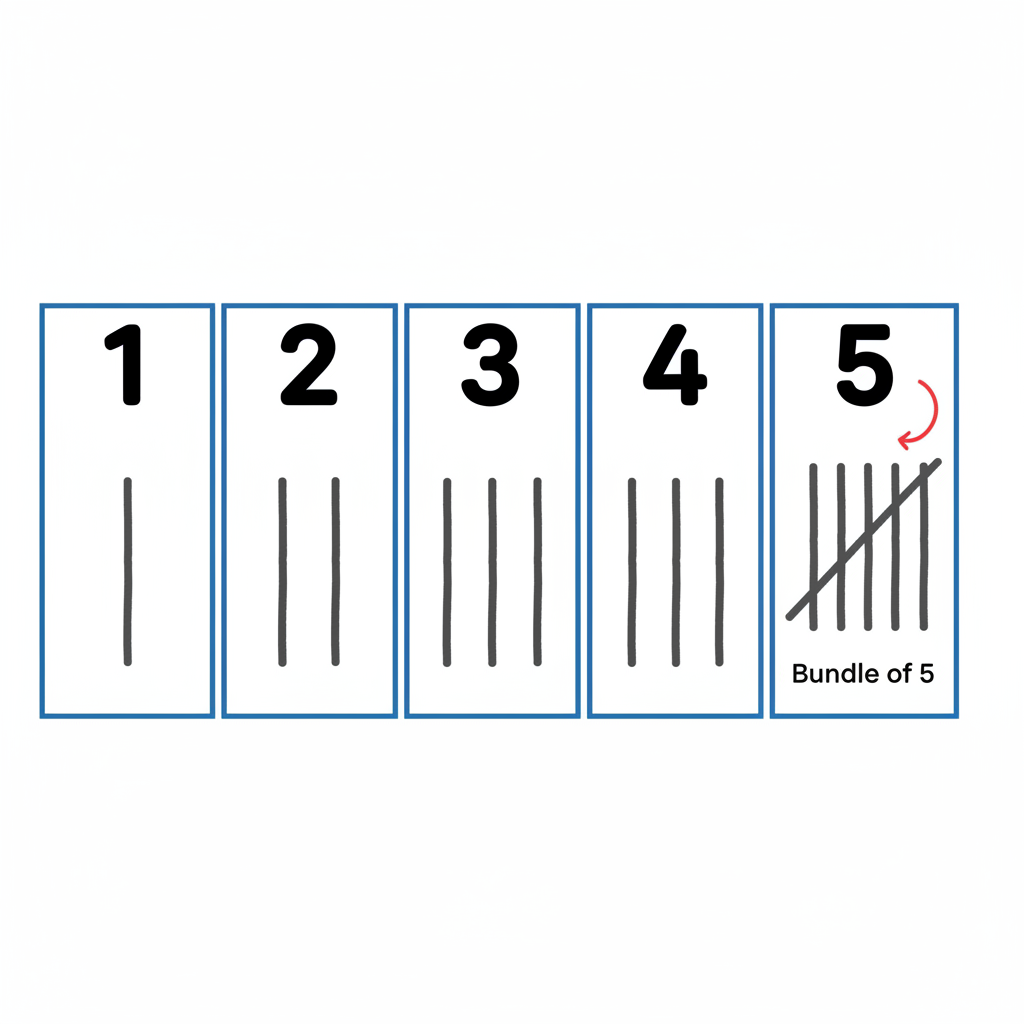
Counting Tally Marks
Counting tally marks becomes super easy with these bundles of five!
- To count a bundle: Just say '5'.
- To count a bundle and some single marks: Count '5' for the bundle, then count on for the single marks.
Let's try some examples:
- ⅇ || = 5 (for the bundle) + 2 (for the two lines) = 7
- ⅇ ⅇ = 5 (for the first bundle) + 5 (for the second bundle) = 10
- ⅇ ⅇ ||| = 5 + 5 + 3 = 13
What is a Tally Chart?
Now that you're a tally mark expert, let's put them into a Tally Chart! A tally chart is like a special organized list or a notepad that uses tally marks to keep track of how many of different things there are. It helps us see information very clearly and quickly.
A typical tally chart has a few important parts:
- A Title: This tells you what the chart is all about. (Example: 'Our Favorite Animals')
- Categories: These are the different things you are counting. (Example: Dog, Cat, Fish)
- Tally Marks Column: This is where you draw your tally marks for each category.
- Total Column: This is where you write the number (like 1, 2, 3, 7, 10) after you've counted all the tally marks.
How to Read a Tally Chart: Becoming a Data Detective!
Reading a tally chart is like being a detective solving a puzzle! You just follow these simple steps:
- Read the Title: First, look at the top to understand what information the chart is showing.
- Look at the Categories: See what different items or choices are listed.
- Count the Tally Marks: For each category, carefully count the tally marks. Remember that each bundle is 5!
- Write the Total: After counting the tally marks for a category, write the number in the 'Total' column.
- Compare and Understand: Once all the totals are written, you can easily see which category has the most, which has the least, or if any are the same!
Let's look at an example!
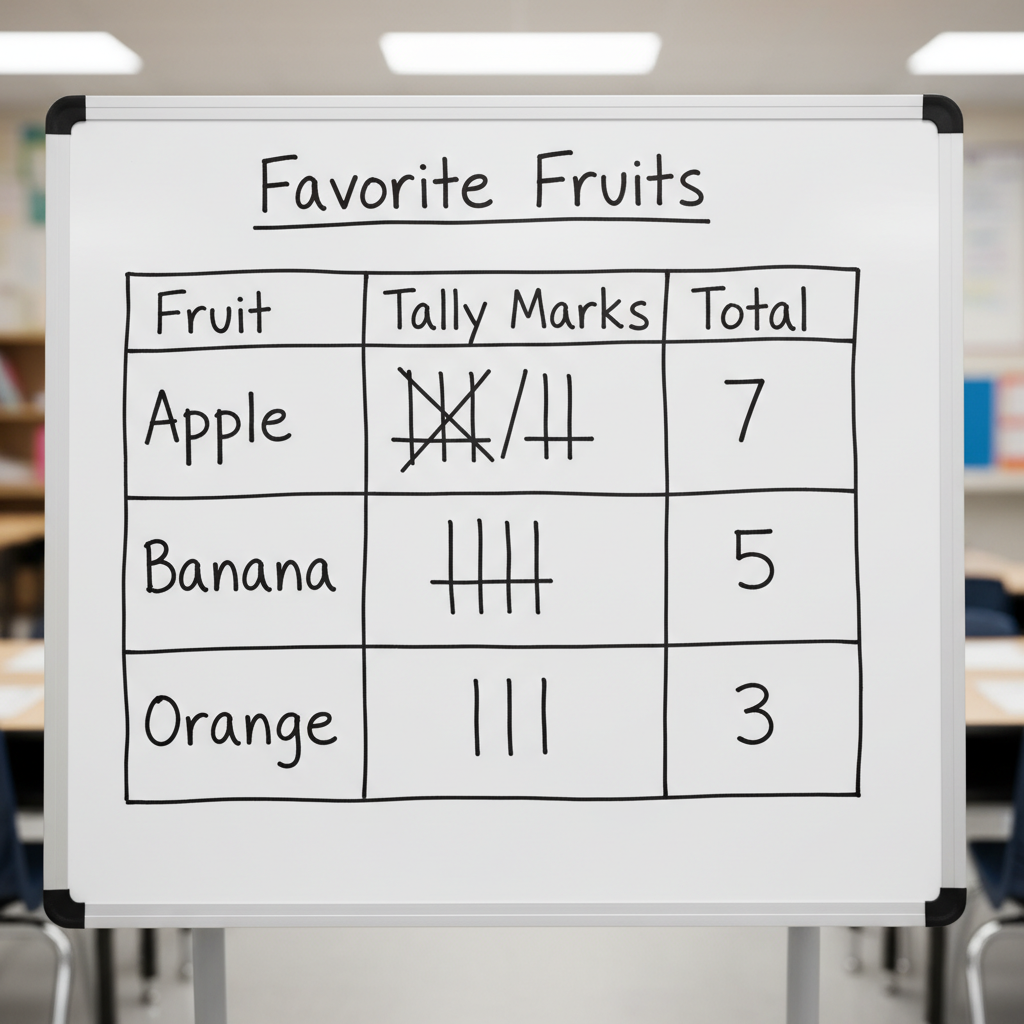
Let's practice reading this 'Favorite Fruits' Tally Chart:
- Apple: Look at the tally marks for Apple: ⅇ ||. That's one bundle of 5, plus 2 more. So, 5 + 2 = 7. (Seven people like apples best!)
- Banana: Look at the tally marks for Banana: ⅇ. That's one bundle of 5. So, 5. (Five people like bananas best!)
- Orange: Look at the tally marks for Orange: |||. That's just three single lines. So, 3. (Three people like oranges best!)
From this chart, we can easily tell that Apples are the most favorite fruit, and Oranges are the least favorite!
Great Job, Tally Chart Reader!
You've learned how to make tally marks, count them in bundles of five, and read a whole tally chart like a pro! Tally charts help us organize and understand information about groups of things, making counting big numbers much easier and clearer. Keep practicing, and you'll be a master of tally charts in no time!
Keep learning, free
Create a free Syllabax account to unlock practice questions and games for this topic.
Visual Learning Enhanced! 🚀
To help you master this topic, we use Advanced Syllabax AI to generate detailed diagrams and visual models.
Note on Visuals: The AI sometimes makes spelling errors in image labels. Please refer to the lesson text for the correct terminology.