Organizing Data: Tally Charts
Watch this topic in 60 seconds
Free preview · Lesson 1
Understanding Organizing Data: Tally Charts
Organizing Data: Tally Charts (Grade 6)
Welcome, young data explorers! Have you ever tried to count something big, like how many cars pass your house in an hour, or how many different kinds of birds visit your backyard? When we collect information like this, it's called data. And just like a messy room, data can be hard to understand if it's not organized. That's where our super tool, the Tally Chart, comes in!
Analogy: Your Messy Room vs. Organized Closet
Imagine your clothes are all over your bedroom floor. It's hard to find your favorite shirt, isn't it? Now, imagine all your clothes are neatly folded in drawers and hung in your closet. Suddenly, finding what you need is easy! Data is the same. When it's messy, it's confusing. When it's organized, it tells us a clear story. Tally charts are like the dresser and hangers for our data!
What is a Tally Chart?
A Tally Chart is a special way to count and keep track of how often something happens. It helps us organize information so we can easily see the results. Instead of writing down a long list of numbers, we use simple lines called tally marks.
Analogy: Keeping Score in a Game
Think about playing a game with friends. When someone scores a point, you might draw a line on a piece of paper. Each line means one point. A tally chart works exactly like that – each line (or tally mark) represents one count of something!
The Building Blocks of a Tally Chart
Every good tally chart has a few important parts:
- Title: This tells us what the chart is about. For example, "Favorite Colors" or "Types of Pets."
- Categories: These are the different things we are counting. If we're counting favorite colors, the categories would be "Red," "Blue," "Green," etc.
- Tally Marks: These are the lines we draw to count. Each line is one count.
- Frequency (or Total): This is the final number for each category, which we get by counting up all the tally marks.
How to Make Tally Marks: The "Bundle of Five" Rule
This is the most important part of using tally charts! To make counting easier, we group tally marks into bundles of five. Here’s how:
- For the first count, draw one vertical line: |
- For the second count, draw another vertical line: ||
- For the third count, draw a third vertical line: |||
- For the fourth count, draw a fourth vertical line: ||||
- For the fifth count, draw a diagonal line across the first four:
||||(It looks like a gate or a fence!)
This group of five makes it super easy to count quickly. You can just count by fives!
Analogy: Counting Fingers and Toes
Imagine you have to count a huge pile of individual fingers and toes, one by one. That would be slow! Now imagine you can just count 'hands' (which have 5 fingers) and 'feet' (which have 5 toes). Much faster, right? Grouping tally marks into fives is like counting by hands – it speeds up the process and reduces mistakes.
Let's Make a Tally Chart: An Example!
Imagine you're trying to find out which type of fruit is most popular among your classmates. Here's the data you collected:
Apple, Banana, Orange, Apple, Grape, Banana, Apple, Orange, Grape, Apple, Banana, Orange, Apple, Grape, Apple
Now, let's turn this messy list into a neat tally chart:
Step 1: Create the Chart Structure
Draw a table with three columns: 'Fruit Type', 'Tally Marks', and 'Frequency'. Add a title.
| Fruit Type | Tally Marks | Frequency |
|---|---|---|
| Apple | ||
| Banana | ||
| Orange | ||
| Grape |
Step 2: Start Tallying!
Go through your list one by one and make a tally mark for each fruit. As you go, cross out the fruit from your list so you don't count it twice.
Apple: |
Banana: |
Orange: |
Apple: ||
Grape: |
Banana: ||
Apple: |||
Orange: ||
Grape: ||
Apple: ||||
Banana: |||
Orange: |||
Apple: |||| (That's one bundle of five!)
Grape: |||
Apple: |||| | (Now we start a new bundle after the first five for Apple)
Step 3: Fill in the Tally Marks and Frequency
Once you've gone through all the data, count your tally marks for each category and write down the total frequency.
| Fruit Type | Tally Marks | Frequency |
|---|---|---|
| Apple | 6 | |
| Banana | ||| | 3 |
| Orange | ||| | 3 |
| Grape | ||| | 3 |
Why Are Tally Charts So Useful?
Tally charts are not just for school projects; they're used everywhere! Here's why they're great:
- Easy to Create: You don't need fancy tools, just a pencil and paper.
- Quick to Update: As you collect new data, you just add another tally mark.
- Simple to Understand: Even a quick glance can tell you which category has the most or the least.
- Helps Spot Patterns: You can easily see trends or popular choices, like how Apple was clearly the most popular fruit in our example!
Analogy: A Supermarket Checkout Line
Imagine you're a cashier at a supermarket. Every time someone buys an apple, you press a button for 'apple'. Every time someone buys a banana, you press a button for 'banana'. At the end of the day, the register tells you how many of each item were sold. A tally chart works in a similar way, but you're doing the 'button pressing' yourself with lines!
Visualizing a Tally Chart
Here's what a completed tally chart looks like, ready to help you understand data at a glance!
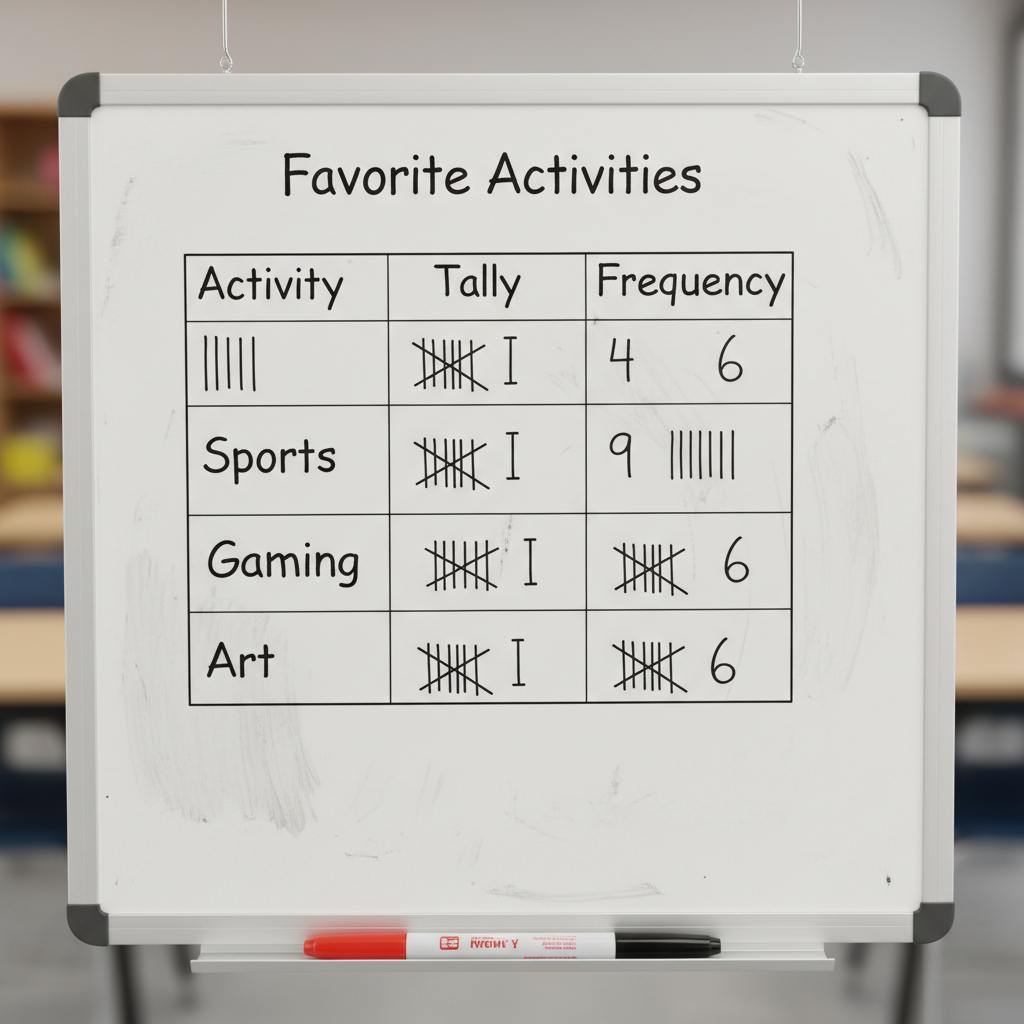 ⚠️ This picture may have spelling mistakes. Trust the words in the lesson.
Time to Practice!
Now that you know all about tally charts, you can use them to count and organize data from your own life. Try keeping a tally chart of:
- The colors of cars that pass your window.
- The different types of birds you see in a park.
- How many times your favorite song plays on the radio.
Remember, organizing data makes it powerful! It helps us make sense of the world around us and answer questions with clear evidence.
Keep learning, free
Create a free Syllabax account to unlock practice questions and games for this topic.
Visual Learning Enhanced! 🚀
To help you master this topic, we use Advanced Syllabax AI to generate detailed diagrams and visual models.
Note on Visuals: The AI sometimes makes spelling errors in image labels. Please refer to the lesson text for the correct terminology.