Reading & interpreting graphs [Data Basics]
Watch this topic in 60 seconds
Free preview · Lesson 1
Understanding Reading & interpreting graphs [Data Basics]
Reading and Interpreting Graphs: Your Data Superpowers!
Hey there, Super Readers and Data Detectives! Welcome to your training ground for understanding graphs. Think of graphs as secret maps that help us see information in a special way. They're like a picture book for numbers and facts, making them easier to understand than just reading a long list of words or numbers.
What is a Graph? Your Visual Storyteller!
Imagine you have a huge pile of LEGO bricks. You have red ones, blue ones, yellow ones, and green ones. If someone asked you, 'How many red bricks do you have?', you'd have to count them all, right? That could take a while! But what if you arranged them by color in neat stacks? Now, you can just look and see that the red stack is the tallest. A graph does something similar for information. It organizes data so you can see patterns and understand things quickly.
Graphs help us answer questions like:
- Which is the most popular?
- Which is the least popular?
- How much did something change over time?
- Are there more of one thing than another?
Why Are Graphs So Important? They Make Data Friendly!
Graphs are like translators for data. Data is just a fancy word for facts and figures. Sometimes, data can be a jumbled mess. Graphs take that mess and turn it into something clear and easy to understand. Think about your favorite ice cream flavors. If a shop owner wanted to know which flavor to buy the most of, they would look at how many scoops of each flavor they sold. A graph would make it super simple to see if vanilla is outselling chocolate, or if strawberry is the least popular.
Graphs are used everywhere!
- In School: Your teachers might use graphs to show how the class did on a test, or to track how much rain fell each month.
- In the News: News reporters use graphs to show how something is changing, like the temperature over a week or how many people are using a new app.
- In Science: Scientists use graphs to show the results of their experiments.
- At Home: You might even use a graph to track how many chores you do each week!
Types of Graphs: Your Data Toolkit!
There are many types of graphs, each good for showing different kinds of information. Let's meet a few common ones:
1. Bar Graphs: The Tall and Short Storytellers
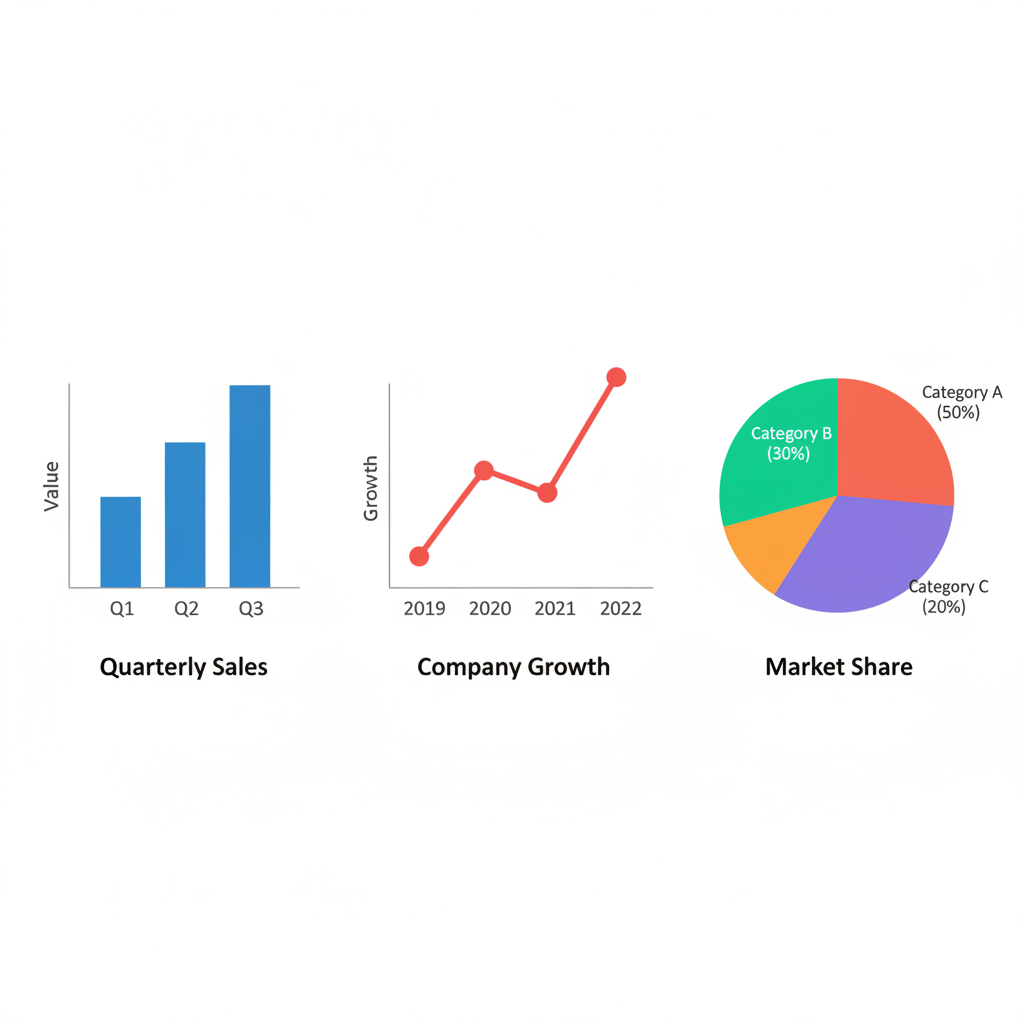
Bar graphs are like comparing the heights of different towers. They use rectangular bars to show and compare data. The taller the bar, the more of something there is. The shorter the bar, the less of something there is.
Imagine you asked your friends their favorite pets: dogs, cats, or hamsters. A bar graph would have one bar for dogs, one for cats, and one for hamsters. The height of the 'dog' bar would show how many friends like dogs, the 'cat' bar would show how many like cats, and so on. You could easily see which pet is the most popular just by looking at which bar is the highest!
Key Parts of a Bar Graph:
- Axis (Ax-ees): These are the lines that form the 'L' shape of the graph.
- Horizontal Axis (X-axis): This is the line that goes across the bottom. It often lists the different categories (like 'dogs', 'cats', 'hamsters').
- Vertical Axis (Y-axis): This is the line that goes up the side. It usually shows the numbers or amounts (like the number of friends who chose each pet).
- Bars: These are the rectangles that show the data.
2. Picture Graphs (Pictographs): The Fun with Icons!
Picture graphs are like using stickers to represent data. Instead of bars, they use little pictures or symbols to show numbers. Each picture stands for a certain amount. For example, if you wanted to show how many fruits were in a basket, you might use an apple picture for every 5 apples.
If one apple picture represents 5 apples, and you have 3 apple pictures, you have 3 * 5 = 15 apples! Picture graphs are great because they are very colorful and easy to understand, especially for younger learners.
3. Line Graphs: The Journey Through Time
Line graphs are like drawing a path to show how something changes over a period of time. They connect a series of dots with a line. Each dot shows a data point at a specific time.
Think about tracking your height as you grow. You measure yourself every month and put a dot on a chart. Then, you connect the dots with a line. This line shows your growth journey! If the line goes up, you're growing taller. If it stays flat, you're not growing much during that time. If it went down (which we hope it doesn't!), it would mean you were shrinking!
Line graphs are fantastic for showing trends – like if something is generally increasing, decreasing, or staying the same.
Key Parts of a Line Graph:
- Horizontal Axis (X-axis): Usually shows time (like days, months, or years).
- Vertical Axis (Y-axis): Usually shows the quantity or amount being measured (like temperature, height, or sales).
- Data Points: The dots on the graph that represent a specific measurement at a specific time.
- Line: Connects the data points to show the trend.
Reading a Graph: Your Detective Skills in Action!
Now that you know about different graphs, how do you actually 'read' them? It's like being a detective solving a case!
Step 1: Look at the Title. Every good map has a title, and so does every graph! The title tells you what the graph is all about. Is it about the number of students who like pizza? Or the temperature outside yesterday? Knowing the title is your first clue.
Step 2: Check the Labels (Axis and Keys).
- Axis Labels: Look at the labels on the X-axis (the bottom line) and the Y-axis (the side line). What do they represent? One might say 'Days of the Week' and the other might say 'Number of Books Read'. This tells you what information is being measured.
- Key or Legend: Sometimes graphs use different colors or symbols for different things. A key or legend tells you what each color or symbol means. For example, a blue line might represent the temperature in the morning, and a red line might represent the temperature in the afternoon.
Step 3: Examine the Data (The Bars, Dots, or Pictures). Now, look at the actual data! For a bar graph, see how tall each bar is and what number it lines up with on the Y-axis. For a line graph, look at the dots and how the line goes up or down. For a picture graph, count the pictures and remember what each one represents.
Step 4: Ask Questions and Find Answers! This is the detective part! Use the graph to answer questions.
- What is the highest point? What does that mean?
- What is the lowest point? What does that mean?
- What is happening between two points?
- Are there any surprises?
Interpreting a Graph: What Does it All Mean?
Reading a graph is about seeing what the data *says*. Interpreting a graph is about figuring out what the data *means*. It’s like looking at a drawing and then telling a story about it.
Example:
Imagine a bar graph titled 'Favorite Colors of Class 6A'. The X-axis shows colors (Red, Blue, Green, Yellow). The Y-axis shows 'Number of Students'. The 'Blue' bar goes up to 10, the 'Green' bar goes up to 8, the 'Red' bar goes up to 6, and the 'Yellow' bar goes up to 4.
- Reading: We can read that 10 students chose blue, 8 chose green, 6 chose red, and 4 chose yellow.
- Interpreting: We can interpret that blue is the most favorite color in Class 6A, and yellow is the least favorite. We can also say that twice as many students like blue as they like yellow (10 is twice 4!). We might also interpret that blue and green together are more popular than red and yellow combined.
Analogy: Weather Report
Think about a weather report. The graph might show the temperature for each day of the week. Reading the graph tells you the exact temperature on Tuesday. Interpreting the graph tells you if it was a hot week, a cold week, or if the temperature went up and down a lot.
Graphs are your tools to become a data master. With practice, you'll be able to look at any graph and understand its story!
Keep learning, free
Create a free Syllabax account to unlock practice questions and games for this topic.
Visual Learning Enhanced! 🚀
To help you master this topic, we use Advanced Syllabax AI to generate detailed diagrams and visual models.
Note on Visuals: The AI sometimes makes spelling errors in image labels. Please refer to the lesson text for the correct terminology.