Learning Journey
Watch this topic in 60 seconds
Free preview · Lesson 1
Understanding Using Tree Diagrams for Outcomes
Exploring Outcomes with Tree Diagrams (Grade 7)
Welcome, young mathematicians! Today, we're going on an adventure to learn a super cool tool called a Tree Diagram. Imagine you're trying to figure out every single possible thing that could happen in a situation. It can get tricky to keep track, right? That's where tree diagrams come in – they help us organize all the different 'paths' or 'choices' we can make, showing us every possible final result, or outcome.
What is an Outcome?
Before we draw any trees, let's make sure we understand what an 'outcome' is. An outcome is simply one possible result of an event or series of events.
Analogy: Your Morning Routine Choices
Think about your breakfast choices. If you can have cereal OR toast, and then juice OR milk, what are all the different breakfasts you could possibly make? Each specific breakfast you end up with (like 'Cereal and Juice' or 'Toast and Milk') is an outcome.
When you flip a coin, there are two outcomes: Heads or Tails. When you roll a standard six-sided die, there are six outcomes: 1, 2, 3, 4, 5, or 6.
What is a Tree Diagram?
A tree diagram is a special kind of diagram that uses 'branches' to show all the possible outcomes of an event or a series of events. It helps us visualize and count every single combination.
Analogy: A Choose-Your-Own-Adventure Book
Imagine reading a 'choose-your-own-adventure' book. You start on page 1. Then, you might have a choice: go left (turn to page 5) or go right (turn to page 7). From page 5, you might have another choice. A tree diagram is like mapping out every single path you could take in that book, from beginning to end, to see all the different stories you could read!
The name 'tree diagram' comes from the way it looks – it starts with a single point and then branches out, just like the branches of a tree.
Why Use Tree Diagrams?
Tree diagrams are incredibly useful because they:
- Organize Information: They help you see all possible outcomes clearly, making sure you don't miss any.
- Count Outcomes: You can easily count the total number of unique outcomes by looking at the very end of the 'branches'.
- Understand Probability: Once you know all possible outcomes, it's easier to figure out the probability of a specific outcome happening.
How to Draw a Tree Diagram: Step-by-Step
Let's learn how to build our own tree diagrams. We'll use a simple example: Flipping a coin twice.
Step 1: Start with the First Event
Draw a starting point (often just a dot). From this point, draw branches for all the possible outcomes of your first event. Label each branch with its outcome.
Example: First Coin Flip
If you flip a coin once, what are the outcomes? Heads (H) or Tails (T). So, from our start, we draw two branches:
- Branch 1: H
- Branch 2: T
Step 2: Add Branches for the Second Event (and beyond!)
From the end of each branch of the first event, draw new branches for all the possible outcomes of your second event. If there's a third event, you'd continue this process from the end of the second event's branches, and so on.
Example: Second Coin Flip
After the first flip (H or T), we flip the coin a second time. No matter what happened on the first flip, the second flip can still be H or T. So:
- From the 'H' branch of the first flip, draw two new branches: H and T.
- From the 'T' branch of the first flip, draw two new branches: H and T.
Step 3: List All Final Outcomes
Now, follow each complete 'path' from the start to the very end of the last branches. Each complete path represents one unique outcome. Write these down!
Example: Listing Outcomes for Two Coin Flips
- Start → H → H (Outcome: HH)
- Start → H → T (Outcome: HT)
- Start → T → H (Outcome: TH)
- Start → T → T (Outcome: TT)
So, there are 4 total possible outcomes when you flip a coin twice.
Let's Do Another Example: Choosing an Outfit
Imagine you have to choose an outfit. You have 2 shirts (Red, Blue) and 3 pairs of pants (Jeans, Khakis, Shorts). How many different outfits can you make?
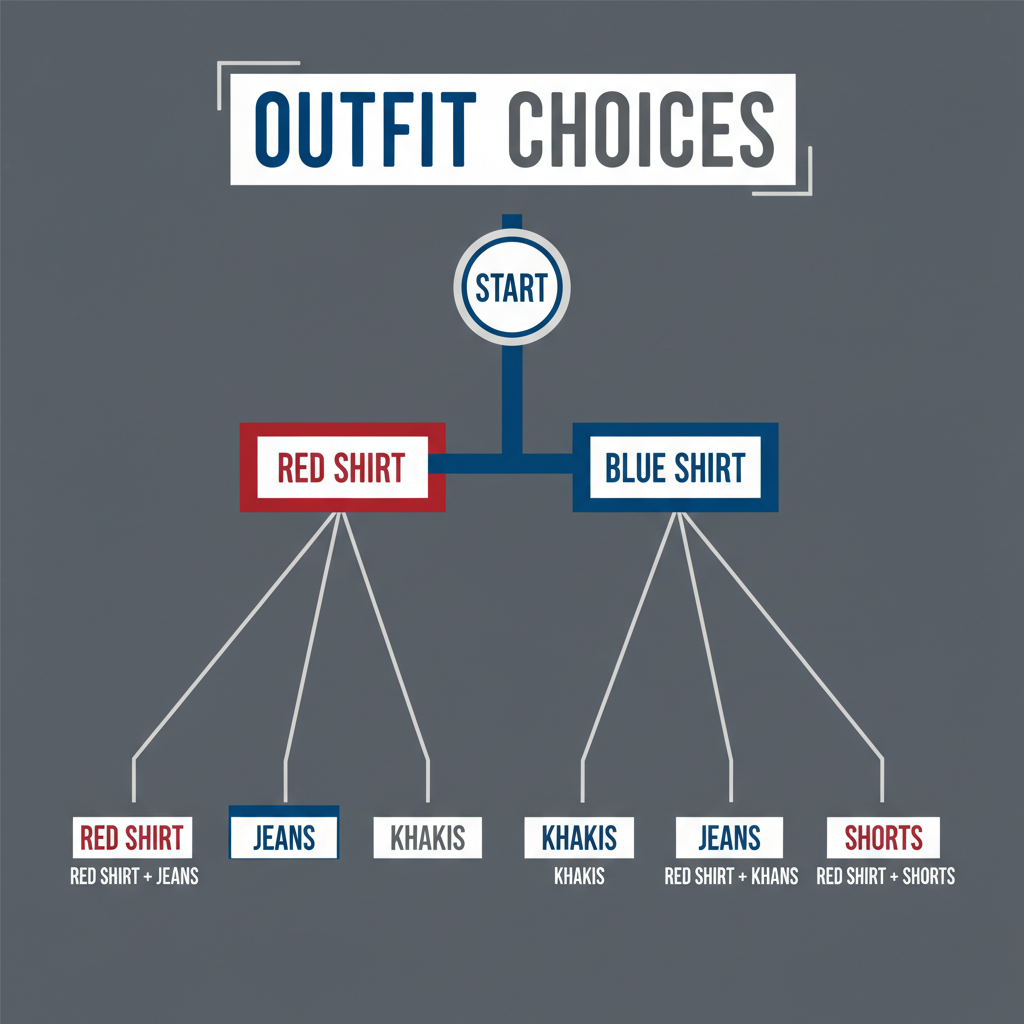 ⚠️ This picture may have spelling mistakes. Trust the words in the lesson.
Drawing the Tree Diagram:
- First Event: Choose a Shirt
- From the start, draw two branches: 'Red Shirt' and 'Blue Shirt'.
- Second Event: Choose Pants
- From the end of the 'Red Shirt' branch, draw three new branches: 'Jeans', 'Khakis', 'Shorts'.
- From the end of the 'Blue Shirt' branch, draw three new branches: 'Jeans', 'Khakis', 'Shorts'.
- List Final Outcomes:
- Red Shirt + Jeans
- Red Shirt + Khakis
- Red Shirt + Shorts
- Blue Shirt + Jeans
- Blue Shirt + Khakis
- Blue Shirt + Shorts
By following all the paths, we find there are 6 different possible outfits!
Analogy: Building a Burger
Think about building a burger. First, you pick your bun (sesame, plain). Then, you pick your patty (beef, chicken, veggie). Then, your cheese (cheddar, swiss). Each choice is a branch! The final burger you bite into is an outcome. A tree diagram helps the restaurant know all the different burgers they can make!
Key Things to Remember
- Always start with the first set of choices or events.
- Each time you have a new set of choices, draw new branches from the end of the previous choices.
- Follow each path from start to end to find all the unique outcomes.
- Tree diagrams are like a map that shows every single possibility!
With a little practice, you'll be a master at using tree diagrams to figure out all the possible outcomes for any situation!
Keep learning, free
Create a free Syllabax account to unlock practice questions and games for this topic.
Visual Learning Enhanced! 🚀
To help you master this topic, we use Advanced Syllabax AI to generate detailed diagrams and visual models.
Note on Visuals: The AI sometimes makes spelling errors in image labels. Please refer to the lesson text for the correct terminology.