Learning Journey
Watch this topic in 60 seconds
Free preview · Lesson 1
Understanding Understanding Our Data
Welcome, Data Detectives! Understanding Our Data (Grade 1)
Hello, super curious learners! Today, we're going on an exciting adventure to become Data Detectives! Have you ever wondered how we know what most people like, or how many red cars passed by your house? The answer is simple: we look for data!
What is Data? Your Secret Clues!
Imagine you're playing a game, and you need to find some clues. Those clues are like data! Data is just another word for information or facts we collect about things. It can be numbers, words, or even pictures!
- Example 1: Your Favorite Color! If I ask everyone in our class, "What's your favorite color?" and you all say 'blue' or 'red' or 'yellow', those answers are data! They are little pieces of information.
- Example 2: How Many Pets? If I ask, "How many pets do you have?" and some say 'one', others say 'two', and some say 'none', those numbers are also data!
Think of data like the ingredients for a delicious cake. Each ingredient (flour, sugar, eggs) is a piece of data. By putting them together, we make something wonderful (the cake!), and by putting data together, we learn wonderful new things!
Why Do We Collect Data? To Learn and Make Smart Choices!
Why do we bother collecting these clues, this data? Because it helps us understand the world around us and make good decisions!
- To Learn New Things: If we count how many children like apples and how many like bananas, we learn which fruit is more popular in our class!
- To Make Smart Choices: If the school cafeteria knows that most kids like pizza, they might decide to make pizza more often. That's using data to make a choice!
It's like knowing how many sunny days we had last week helps us decide if we need our umbrellas or our sunglasses more often!
How Do We Gather Our Data Clues? Be a Super Sleuth!
There are many ways to collect data, just like there are many ways to find clues!
1. Asking Questions (Surveys!)
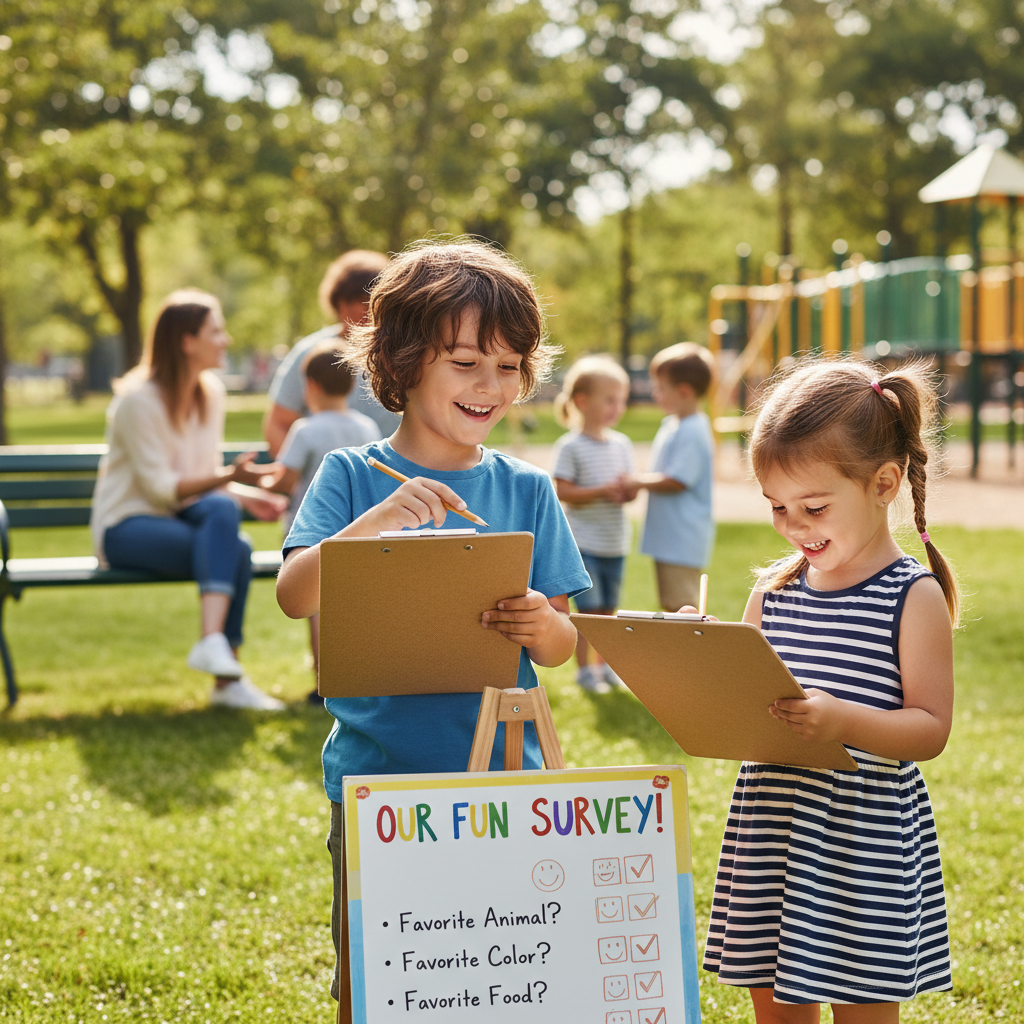
One common way is simply to ask people questions! This is called a survey. You can ask your friends, your family, or even your teachers!
- "What's your favorite animal?"
- "Do you like to read books or play games more?"
When you ask, you listen carefully to their answers and write them down.
2. Looking and Counting (Observation!)
Sometimes, we don't even need to ask! We can just look and count things. This is called observation.
- Counting how many red shirts people are wearing today.
- Counting how many birds you see at the park.
- Counting how many different colored blocks are in a basket.
It's like watching ants on the ground – you count how many go one way and how many go another, without asking them!
3. Making Tally Marks!
When we count, a very helpful way to keep track is by making tally marks. A tally mark is just a little line ( | ). Every time you count something, you make a line. When you get to five, you make a line across the first four ( | | | | ₭ ) to make a neat little bundle of five!
 ⚠️ This picture may have spelling mistakes. Trust the words in the lesson.
This makes counting big groups much easier!
Organizing Our Data Clues: Making Sense of It All!
Once we have all our clues (data), it can look a bit messy. Imagine all your toys scattered everywhere! We need to organize them so we can understand what they tell us. Organizing data helps us see patterns and compare things easily.
1. Tally Charts
We already learned about tally marks! A tally chart is simply a table where we list the things we are counting and use tally marks to show how many of each we have. It’s a super simple way to organize!
| Favorite Fruit | Tally Marks | Total |
|---|---|---|
| Apple | | | | | | 4 |
| Banana | | | | | ₭ | | | 7 |
| Orange | | | | | 3 |
2. Picture Graphs (Pictographs!)
A picture graph, or pictograph, is a fun way to show data using pictures! Instead of numbers, you draw a picture for each item you count. For example, if 5 kids like apples, you draw 5 apple pictures!
Each picture can represent one thing, or sometimes, it can represent more than one (but for Grade 1, one picture = one item is perfect!).
3. Bar Graphs (Baby Steps!)
A bar graph uses colorful bars or blocks to show how much of something there is. Taller bars mean there is more of that thing, and shorter bars mean there is less. It’s like building towers with blocks – a tall tower means many blocks, a short tower means few!
What Do Our Data Clues Tell Us? The Big Reveal!
Once our data is organized in a chart or a graph, we can easily see what it tells us! This is the most exciting part of being a Data Detective!
- Most and Least: We can quickly see which item has the most (the biggest number, the tallest bar, the most pictures) and which has the least (the smallest number, the shortest bar, the fewest pictures).
- Comparing: We can compare different groups. "Are there more kids who like blue or more who like green?"
- Total: We can add up all the numbers to find out the total number of things we counted.
For example, looking at our fruit tally chart:
- Which fruit is liked the most? Bananas! (7 kids)
- Which fruit is liked the least? Oranges! (3 kids)
- Are there more kids who like apples or bananas? More who like bananas!
You are a Data Detective!
See? Collecting and understanding data is like solving a puzzle. It helps us learn so many interesting things about our classroom, our friends, and the world around us. Keep your eyes open, keep asking questions, and keep counting – you're all amazing data detectives!
Keep learning, free
Create a free Syllabax account to unlock practice questions and games for this topic.
Visual Learning Enhanced! 🚀
To help you master this topic, we use Advanced Syllabax AI to generate detailed diagrams and visual models.
Note on Visuals: The AI sometimes makes spelling errors in image labels. Please refer to the lesson text for the correct terminology.