Creating Box-and-Whisker Plots
Watch this topic in 60 seconds
Free preview · Lesson 1
Understanding Creating Box-and-Whisker Plots
Understanding Box-and-Whisker Plots: A Simple Guide for 7th Graders
Have you ever wanted to understand a whole bunch of numbers at a glance? Imagine you have a list of everyone's scores on a math test, or the number of books students read in a month. Just looking at a long list of numbers can be overwhelming, right? That's where a super helpful tool called a Box-and-Whisker Plot comes in! It's like a special diagram that summarizes a whole set of data in a very easy-to-understand picture.
What is a Box-and-Whisker Plot?
Think of it like a 'data snapshot' or a 'visual report card' for your numbers. It shows you how spread out your data is, where the middle is, and where the lowest and highest points are. It's especially good for comparing different groups of data quickly.
Imagine you're trying to describe a whole group of friends standing in a line. Instead of telling someone each friend's exact height, you could just say: "The shortest friend is [A], the tallest is [B], half the friends are shorter than [C], and the middle half of the friends are between [D] and [E] tall." That's exactly what a Box-and-Whisker plot does for numbers!
The Five-Number Summary: The Building Blocks
Every Box-and-Whisker Plot is built on five key numbers. These are like the 'super important' points you need to find in your data. Let's explore them:
-
1. Minimum Value (The Smallest)
This is simply the smallest number in your entire data set. If you line up all your friends by height from shortest to tallest, the minimum value is the shortest friend's height. It's the starting point of your data journey.
-
2. Maximum Value (The Largest)
You guessed it! This is the largest number in your entire data set. In our friend analogy, it's the tallest friend's height. It's the end point of your data journey.
-
3. Median (The Middle Child - Q2)
The median is the middle number when your data is arranged in order from smallest to largest. It splits your data exactly in half! If you have an odd number of friends, the median is the height of the friend right in the middle. If you have an even number of friends, you take the two middle friends' heights, add them up, and divide by 2.
Analogy: Imagine slicing a pizza into two equal halves. The cut line is like your median. Half the pizza is on one side, half is on the other.
-
4. Lower Quartile (Q1 - The First Quarter)
Once you've found the median, you now have two halves of data (a lower half and an upper half). The Lower Quartile (often called Q1) is the median of the lower half of your data. It marks the point where 25% of your data falls below it.
Analogy: If your pizza is already cut in half by the median, now you cut the lower half in half again. The new cut line for that smaller half is Q1. Now you have a quarter of the pizza!
-
5. Upper Quartile (Q3 - The Third Quarter)
Similar to Q1, the Upper Quartile (often called Q3) is the median of the upper half of your data. It marks the point where 75% of your data falls below it (or 25% falls above it).
Analogy: Go back to your pizza. Now cut the upper half of the pizza in half. That new cut line is Q3. Now you have three quarters of the pizza past Q3.
These five numbers are called the Five-Number Summary.
How to Create a Box-and-Whisker Plot: Step-by-Step!
Let's use an example. Imagine these are the number of minutes 10 students spent reading last night: 10, 25, 15, 30, 5, 20, 25, 10, 35, 20.
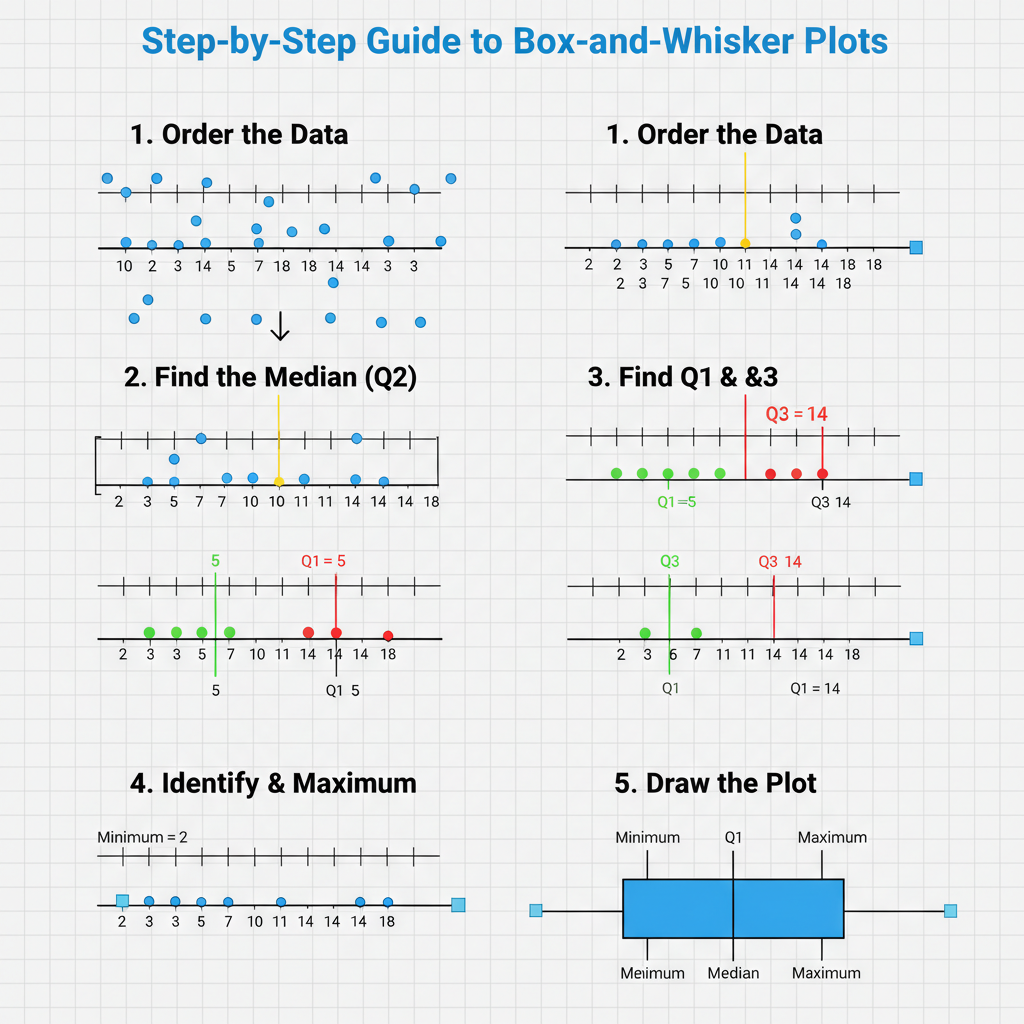 ⚠️ This picture may have spelling mistakes. Trust the words in the lesson.
Step 1: Order Your Data
This is crucial! Always arrange your numbers from smallest to largest. If you don't, your plot will be incorrect.
Our data: 5, 10, 10, 15, 20, 20, 25, 25, 30, 35
Step 2: Find the Minimum and Maximum Values
- Minimum: The smallest number is
5. - Maximum: The largest number is
35.
Step 3: Find the Median (Q2)
There are 10 numbers, which is an even set. So, we find the two middle numbers and average them.
5, 10, 10, 15, 20, 20, 25, 25, 30, 35
The middle two numbers are 20 and 20. (20 + 20) / 2 = 20.
Median (Q2): 20
Step 4: Find the Lower Quartile (Q1)
Now, look at the lower half of your data (all numbers before the median). Do NOT include the median if it was one of your original data points and you had an odd set. Since our median was an average of two numbers, we split the data perfectly.
Lower half: 5, 10, 10, 15, 20
The median of this lower half (Q1) is the middle number: 10.
Lower Quartile (Q1): 10
Step 5: Find the Upper Quartile (Q3)
Next, look at the upper half of your data (all numbers after the median).
Upper half: 20, 25, 25, 30, 35
The median of this upper half (Q3) is the middle number: 25.
Upper Quartile (Q3): 25
Okay! We have our Five-Number Summary:
- Minimum: 5
- Q1: 10
- Median (Q2): 20
- Q3: 25
- Maximum: 35
Step 6: Draw a Number Line
Draw a straight line and mark numbers that cover the range from your minimum to your maximum (and a little beyond). Make sure the numbers are evenly spaced.
Step 7: Mark the Five Points
Place a small vertical line or a dot above the number line for each of your five summary points: Min (5), Q1 (10), Median (20), Q3 (25), Max (35).
Step 8: Draw the 'Box'
Draw a rectangular box that stretches from Q1 (10) to Q3 (25). This box represents the middle 50% of your data. The length of this box is called the Interquartile Range (IQR), which is simply Q3 - Q1 (25 - 10 = 15). It tells you how spread out the middle part of your data is.
Step 9: Draw the 'Whiskers'
Draw a line (a 'whisker') from the minimum value (5) to the edge of the box at Q1 (10).
Draw another line (a 'whisker') from the maximum value (35) to the edge of the box at Q3 (25).
Step 10: Draw the Median Line
Inside your box, draw a vertical line at the median (20).
And that's it! You've created a Box-and-Whisker Plot! You can now easily see that the reading times ranged from 5 to 35 minutes, half the students read between 10 and 25 minutes, and the middle reading time was 20 minutes. Neat, huh?
Why are Box-and-Whisker Plots Useful?
- Quick Summary: They give you a quick visual summary of a large set of data.
- Shows Spread: You can easily see how spread out the numbers are. Are they all close together, or are they very far apart?
- Easy Comparison: They are excellent for comparing two or more sets of data side-by-side. Imagine two classes taking the same test; you could make a box plot for each class and immediately see which class generally did better and which had a wider range of scores.
- Identifies Key Points: You can instantly spot the lowest, highest, and middle values, as well as the 'middle 50%' of the data.
Mastering Box-and-Whisker Plots helps you become a data detective, quickly solving the mystery of what numbers are trying to tell you!
Keep learning, free
Create a free Syllabax account to unlock practice questions and games for this topic.
Visual Learning Enhanced! 🚀
To help you master this topic, we use Advanced Syllabax AI to generate detailed diagrams and visual models.
Note on Visuals: The AI sometimes makes spelling errors in image labels. Please refer to the lesson text for the correct terminology.