Learning Journey
Free preview · Lesson 1
Understanding Ungrouped & grouped data (Statistics)
Unpacking Data: Ungrouped vs. Grouped Data (Grade 9 Statistics)
Welcome to the exciting world of statistics! Imagine you're trying to understand a large collection of information. It could be anything: the heights of all students in your school, the scores on a math test, or even the number of siblings your friends have. This 'information' is what we call data. Just like a chef needs to organize ingredients before cooking, a statistician needs to organize data before making sense of it. In this lesson, we'll learn about two fundamental ways to organize data: ungrouped data and grouped data.
What is Data, Anyway?
Before we dive into ungrouped and grouped data, let's make sure we're clear on what data is. Data is simply a collection of facts, figures, or information. Think of it like a bunch of pieces of a puzzle. Each piece, on its own, might not tell you much, but when you put them together, they form a complete picture.
Analogy 1: Your Toy Box
Imagine your toy box. Inside, you might have LEGO bricks, action figures, toy cars, and board game pieces all mixed up. Each individual toy is a piece of data. If you just look at one LEGO brick, it's a piece of data. If you look at all the toys together, that's your dataset.
Ungrouped Data: The Raw Facts
Let's start with ungrouped data. This is the simplest form of data. It's essentially the raw, individual pieces of information exactly as you collected them, without any specific organization or sorting into categories. Each data point stands on its own.
Think back to our toy box. If you just dump all your toys out and look at each one individually – 'a red LEGO brick', 'a blue toy car', 'a green action figure' – that's ungrouped data. You're looking at each item separately.
Characteristics of Ungrouped Data:
- Raw and Unprocessed: It's data in its original form, just as it was collected.
- Individual Values: You can see every single value distinctly. For example, if you measure the heights of five students as 150 cm, 155 cm, 148 cm, 160 cm, and 152 cm, you can see each height clearly.
- Best for Small Datasets: Ungrouped data is easy to manage and understand when you have a small number of data points.
- Can be Messy: If you have a huge amount of ungrouped data, it can be overwhelming and difficult to spot trends or patterns quickly.
Examples of Ungrouped Data:
- Scores on a small quiz: 8, 7, 9, 6, 8, 10, 7, 9, 8, 7 (for 10 students).
- Number of pets owned by 5 friends: 1, 2, 0, 1, 3.
- Favorite colors of a small group of people: Blue, Red, Green, Yellow, Blue, Red.
Analogy 2: A Handful of Coins
Imagine you have a handful of coins: a quarter, a dime, a nickel, another quarter, and a penny. If you list them out as '25 cents, 10 cents, 5 cents, 25 cents, 1 cent', that's ungrouped data. You're seeing each coin's value individually.
Grouped Data: Organized for Clarity
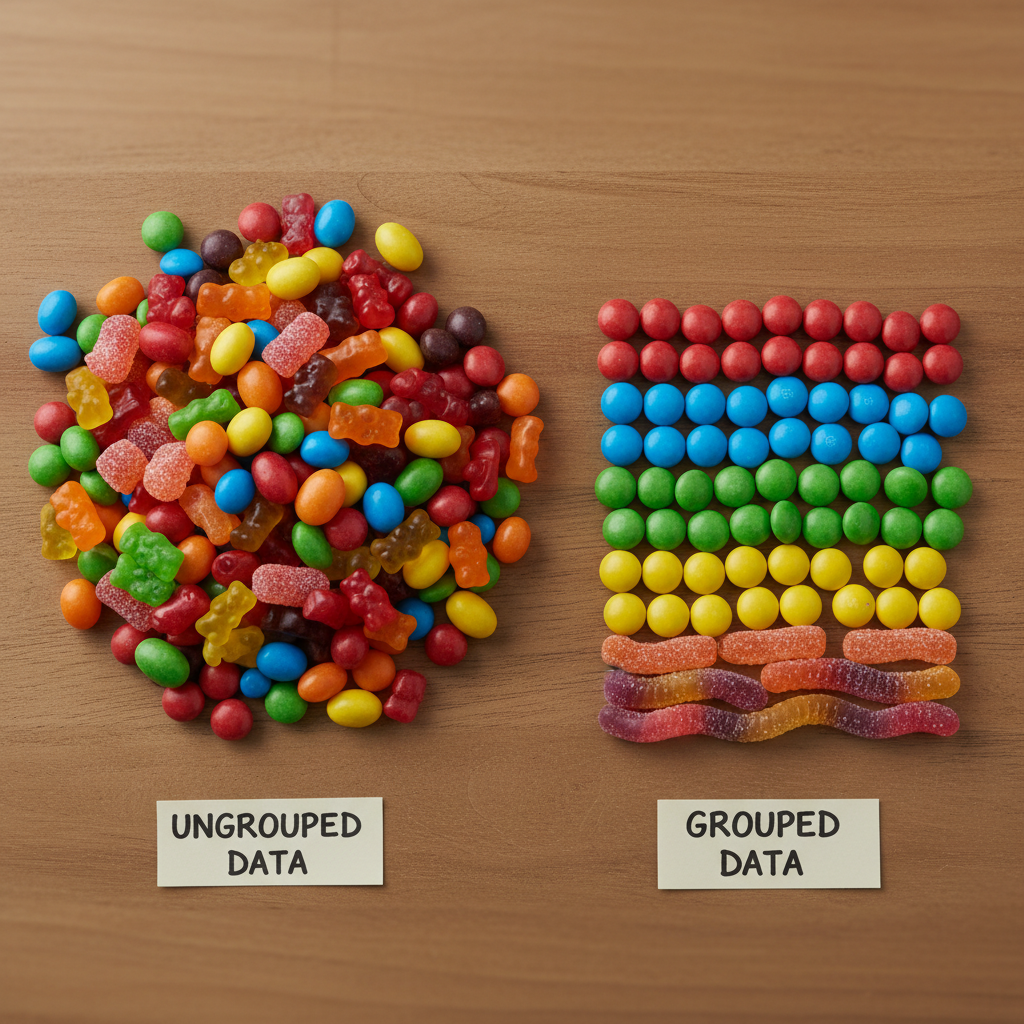
Now, what happens when you have a mountain of data? Imagine measuring the heights of 500 students! Listing each one individually would be incredibly long and hard to make sense of. This is where grouped data comes in. Grouped data is data that has been organized into categories or intervals, also known as classes.
Instead of looking at each individual data point, we put similar data points together into groups. This makes large datasets much more manageable and easier to analyze, allowing us to see overall trends and distributions.
Characteristics of Grouped Data:
- Organized into Classes/Intervals: Data points are placed into ranges or categories.
- Easier to See Patterns: When data is grouped, it's much easier to spot where most of the data falls, or if there are any outliers.
- Essential for Large Datasets: For hundreds or thousands of data points, grouping is almost always necessary.
- Loss of Individual Detail: The trade-off is that you lose the exact individual values. If you know a student's height is in the '150-155 cm' group, you don't know if they are exactly 150 cm or 154 cm.
Key Terms for Grouped Data:
- Class Interval: This is the range or category into which data is grouped. For example, '150-155 cm' is a class interval.
- Class Limits: These are the boundary values for each class interval. In '150-155 cm', 150 cm is the lower class limit and 155 cm is the upper class limit.
- Frequency: This is the number of data points that fall within a particular class interval. If 15 students have heights between 150 cm and 155 cm, then the frequency for that class interval is 15.
Example of Grouped Data:
Let's take those 500 student heights. Instead of listing each height, we might group them like this:
| Height (cm) - Class Interval | Number of Students (Frequency) |
|---|---|
| 140 - 145 | 25 |
| 145 - 150 | 70 |
| 150 - 155 | 150 |
| 155 - 160 | 130 |
| 160 - 165 | 90 |
| 165 - 170 | 35 |
| Total | 500 |
This table is called a frequency distribution table. Notice how much easier it is to get an idea of the distribution of heights compared to seeing 500 individual numbers!
Analogy 3: Sorting Your LEGO Bricks
Remember your toy box with all the mixed-up LEGO bricks? If you sort them into separate bins by color (e.g., one bin for red, one for blue, one for green), you've just created grouped data! Each bin is a 'class interval' (like 'red bricks'), and the number of bricks in each bin is the 'frequency'. You can quickly see which color you have most of, but you can't tell the exact shape or size of every single red brick without looking inside that bin.
Choosing Between Ungrouped and Grouped Data
So, when do you use which? It primarily depends on the size of your dataset and what you want to achieve:
- Use Ungrouped Data When:
- You have a small amount of data (e.g., less than 20-30 data points).
- You need to see the exact value of every single data point.
- You're just starting to organize and haven't decided on categories yet.
- Use Grouped Data When:
- You have a large amount of data (e.g., hundreds or thousands of data points).
- You want to identify patterns, trends, or the general distribution of the data.
- Exact individual values are less important than the overall picture.
- You need to create visual representations like histograms (which you'll learn about soon!).
Analogy 4: Counting Your Money
If you have just a few coins, you'd count them individually (ungrouped data). But if you work at a bank and have hundreds of thousands of coins, you wouldn't count each one! You'd sort them into rolls (like groups of 50 quarters, 50 dimes, etc.) and count the rolls (grouped data). You lose the exact position of each coin, but you gain efficiency and a clear total.
From Ungrouped to Grouped: A Transformation
It's important to remember that grouped data usually starts its life as ungrouped data. You collect all the raw, individual numbers (ungrouped), and then you make decisions about how to categorize or 'group' them. This involves deciding on the number of classes, the width of each class interval, and then tallying how many data points fall into each category.
Steps to Create Grouped Data (Briefly):
- Collect Raw Data: Get all your individual numbers (ungrouped data).
- Find Range: Determine the smallest and largest values in your data.
- Decide Number of Classes: Choose how many groups you want (usually between 5 and 15).
- Calculate Class Width: Divide the range by the number of classes.
- Create Class Intervals: Set up your groups based on the class width.
- Tally Frequencies: Go through your raw data and mark which class interval each data point belongs to, then count them up to get the frequency for each class.
Conclusion
Understanding the difference between ungrouped and grouped data is a foundational step in statistics. Ungrouped data gives you the specific details for small datasets, while grouped data provides a bird's-eye view, making large datasets understandable and revealing patterns that would otherwise be hidden in a sea of numbers. Being able to choose the right way to represent your data is a powerful skill that will help you make sense of the world around you!
Keep learning, free
Create a free Syllabax account to unlock practice questions and games for this topic.
Visual Learning Enhanced! 🚀
To help you master this topic, we use Advanced Syllabax AI to generate detailed diagrams and visual models.
Note on Visuals: The AI sometimes makes spelling errors in image labels. Please refer to the lesson text for the correct terminology.