Types of Data
Watch this topic in 60 seconds
Free preview · Lesson 1
Understanding Types of Data
Understanding the World: Types of Data
Imagine you're trying to describe something – maybe your favorite ice cream flavor, or your best friend, or even just what happened yesterday. You use words, numbers, and observations, right? All of this information is what we call data!
Think of data like the ingredients for a delicious cake. You have flour, sugar, eggs, and milk. Each ingredient is a piece of data. Just like different ingredients have different roles (flour for structure, sugar for sweetness), different types of data tell us different kinds of stories about the world.
In this lesson, we're going to become data detectives and learn how to identify the two main types of data: Qualitative and Quantitative. We'll also dig a little deeper into Quantitative data to find its two secret identities!
1. Qualitative Data: Describing the World
Let's start with Qualitative Data. The word "qualitative" comes from "quality," which means how something is. So, qualitative data is all about describing qualities or characteristics. It tells us "what kind" or "how it is."
Analogy Time!
Imagine you're describing your pet cat, Mittens. You might say:
- "Mittens has soft, fluffy fur." (Describes the texture – a quality)
- "Mittens is mostly orange with white paws." (Describes the color – a quality)
- "Mittens loves to purr loudly." (Describes a sound – a quality)
- "Mittens is a very friendly cat." (Describes her personality – a quality)
Notice that none of these descriptions involve numbers. They're all about words and observations that help us understand Mittens' characteristics. Qualitative data is often collected through observations, interviews, or descriptions.
Examples of Qualitative Data:
- The color of a car (red, blue, green)
- The type of music you like (rock, pop, classical)
- Your favorite subject in school (math, art, history)
- The smell of a flower (sweet, fresh, earthy)
- The texture of a fabric (smooth, rough, silky)
- Someone's name (Sarah, Michael, Emily)
Think of qualitative data as the "storytelling" data. It helps us understand the "why" and "how" things are, often giving us rich, detailed insights.
2. Quantitative Data: Measuring the World
Now, let's switch gears to Quantitative Data. The word "quantitative" comes from "quantity," which means an amount. So, quantitative data is all about numbers and measurements. It tells us "how much," "how many," or "how often."
Analogy Time!
Let's go back to our cat, Mittens. If we were collecting quantitative data about her, we might say:
- "Mittens weighs 10 pounds." (A measurement of weight)
- "Mittens is 2 years old." (A measurement of age)
- "Mittens eats 2 cans of food per day." (A count of food cans)
- "Mittens can jump 3 feet high." (A measurement of height)
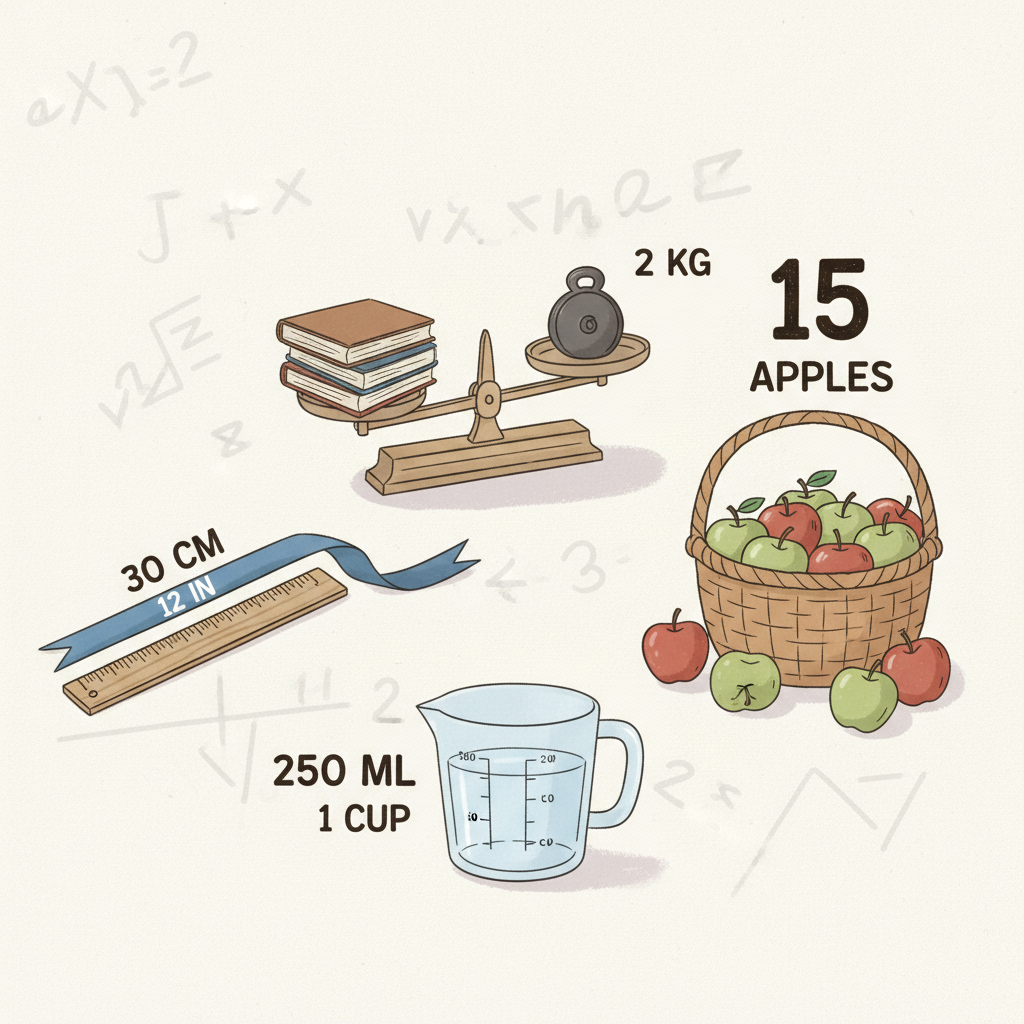
See how all these descriptions involve numbers? Quantitative data is often collected using tools like rulers, scales, thermometers, or by simply counting things.
 ⚠️ This picture may have spelling mistakes. Trust the words in the lesson.
The Two Secret Identities of Quantitative Data:
Quantitative data isn't just one big group; it has two important sub-types:
2a. Discrete Data: Counting Whole Things
Discrete data is data that can be counted. It can only take specific, separate values, usually whole numbers, and there are gaps between these values. You can't have half of something when it comes to discrete data.
Analogy Time!
Think about the number of eggs in a carton. You can have 6 eggs, or 12 eggs, but you can't really have 7.5 eggs (unless one is broken, but even then, it's still a discrete "broken egg"). Or imagine the number of students in a classroom. You can have 25 students or 26 students, but not 25.3 students.
Examples of Discrete Data:
- The number of cars in a parking lot (you can count them: 1, 2, 3...)
- The number of siblings you have (you can't have 1.5 siblings)
- The number of goals scored in a soccer game
- The number of books on a shelf
- The size of a shoe (like shoe size 8 or 9, not 8.375)
2b. Continuous Data: Measuring Anything in Between
Continuous data is data that can be measured. It can take any value within a given range, including fractions and decimals. There are no gaps; between any two values, there's always another possible value.
Analogy Time!
Think about your height. You might say you're 5 feet tall, but you could also be 5 feet and 1 inch, or 5 feet and 1.5 inches, or even 5 feet and 1.578 inches! As long as your measuring tool is precise enough, you could find more and more specific values. The temperature outside is another great example. It could be 20 degrees, 20.5 degrees, or 20.57 degrees Celsius.
Examples of Continuous Data:
- Your height (can be 5.2 feet, 5.21 feet, etc.)
- Your weight (can be 95.3 kg, 95.34 kg, etc.)
- The time it takes to run a race (e.g., 10.5 seconds, 10.53 seconds)
- The temperature outside (e.g., 72.8 degrees Fahrenheit)
- The distance from your home to school
- The amount of water in a bottle
Why Does Knowing the Type of Data Matter?
Understanding the difference between these types of data is super important because it helps us choose the right way to organize, analyze, and present information. Just like you wouldn't use a screwdriver to hammer a nail, you wouldn't use certain math tools for qualitative data. Knowing the type helps you:
- Understand the information better: What kind of story is this data telling?
- Choose the right way to measure or collect: Do I count or do I measure?
- Pick the right graphs and charts: Bar graphs for qualitative, histograms for continuous quantitative, etc.
- Make better decisions: Accurate analysis leads to smarter choices!
Recap: Your Data Detective Toolkit
You've now learned the foundational skills of a data detective! Remember:
- Data is just information.
- Qualitative Data describes qualities (like color, smell, feelings – words!).
- Quantitative Data measures quantities (like height, weight, counts – numbers!).
- Discrete Data (a type of quantitative) is counted in whole numbers (like number of pets).
- Continuous Data (another type of quantitative) is measured and can have fractions/decimals (like height or temperature).
Keep practicing, and you'll be a data expert in no time!
Keep learning, free
Create a free Syllabax account to unlock practice questions and games for this topic.
Visual Learning Enhanced! 🚀
To help you master this topic, we use Advanced Syllabax AI to generate detailed diagrams and visual models.
Note on Visuals: The AI sometimes makes spelling errors in image labels. Please refer to the lesson text for the correct terminology.