Pictographs [Data Representation]
Watch this topic in 60 seconds
Free preview · Lesson 1
Understanding Pictographs [Data Representation]
Understanding Pictographs: Painting Pictures with Data!
Hello awesome learners! Today, we're going on an exciting adventure into the world of data. Data is just a fancy word for information, like how many students like pizza, how many dogs are in our neighborhood, or how many books were read last week. But how do we make sense of all this information? That's where pictographs come in!
What is a Pictograph?
Imagine you have a box full of colorful crayons. You want to know which color is the most popular among your friends. You could ask everyone, but then you'd have a long list of names. A pictograph is like drawing a picture to show your data. Instead of writing down every single person's choice, you use little pictures or symbols to represent the information.
Think of a pictograph as a picture dictionary for numbers. Each picture or symbol stands for a certain amount. For example, if we're talking about how many ice creams your friends ate, one drawing of an ice cream cone might represent 2 ice creams eaten. This makes it super easy to see who ate the most or the least, just by looking at the pictures!
Why Use Pictographs?
Pictographs are like a secret code that makes numbers easy to understand. Here's why they're so cool:
- They're Visual: Our eyes love pictures! Pictographs use images, which makes them more interesting and easier to look at than just rows and columns of numbers. It's like looking at a fun cartoon instead of a boring math problem.
- They're Simple: Even if the numbers are big, using symbols can make them seem smaller and more manageable. If 100 people like blue, drawing 10 smiley faces where each face represents 10 people is much easier than drawing 100 smiley faces!
- They Tell a Story: A pictograph can quickly show you trends or comparisons. You can instantly see if one category has way more or less than another. It's like a snapshot of your information that tells you what's happening.
Parts of a Pictograph
Every good pictograph needs a few important parts:
- Title: This tells you what the pictograph is all about. It's like the headline of a newspaper article, telling you the main topic. For example, "Favorite Fruits of Class 5B".
- Labels: These tell you what each row or column represents. If you're showing how many apples, bananas, and oranges were eaten, you need labels for each fruit.
- Symbols (or Icons): These are the pictures used to represent the data. They should be simple and easy to recognize. Like a little apple drawing for apples, or a little car drawing for cars.
- Key (or Legend): This is the most important part! The key tells you what each symbol *means*. It's like a translator for your pictures. For example, the key might say: 🍎 = 2 apples. So, if you see three apple symbols, it means 3 x 2 = 6 apples were eaten! Without a key, the pictures wouldn't make any sense.
Let's Build a Pictograph!
Imagine we asked our class, "How many pets do you have?" Here are the answers:
- Alice: 2
- Bob: 4
- Charlie: 0
- Diana: 6
- Ethan: 2
Now, let's make a pictograph. We need a title, labels for each student, and symbols. Let's decide that one 🐾 (paw print) symbol will represent 1 pet.
Step 1: Title
Our title will be: "Number of Pets in Our Class"
Step 2: Labels
We'll have labels for Alice, Bob, Charlie, Diana, and Ethan.
Step 3: Symbols and Key
We'll use a paw print 🐾. Our key will be: 🐾 = 1 pet
Step 4: Drawing the Pictures
- Alice: Needs 2 pets, so she gets 2 paw prints. 🐾🐾
- Bob: Needs 4 pets, so he gets 4 paw prints. 🐾🐾🐾🐾
- Charlie: Needs 0 pets, so he gets 0 paw prints.
- Diana: Needs 6 pets, so she gets 6 paw prints. 🐾🐾🐾🐾🐾🐾
- Ethan: Needs 2 pets, so he gets 2 paw prints. 🐾🐾
Now, let's put it all together:
Number of Pets in Our Class
Alice: 🐾🐾
Bob: 🐾🐾🐾🐾
Charlie:
Diana: 🐾🐾🐾🐾🐾🐾
Ethan: 🐾🐾
Key: 🐾 = 1 pet
Look how easy it is to see that Diana has the most pets and Charlie has none! We can also see that Alice and Ethan have the same number of pets.
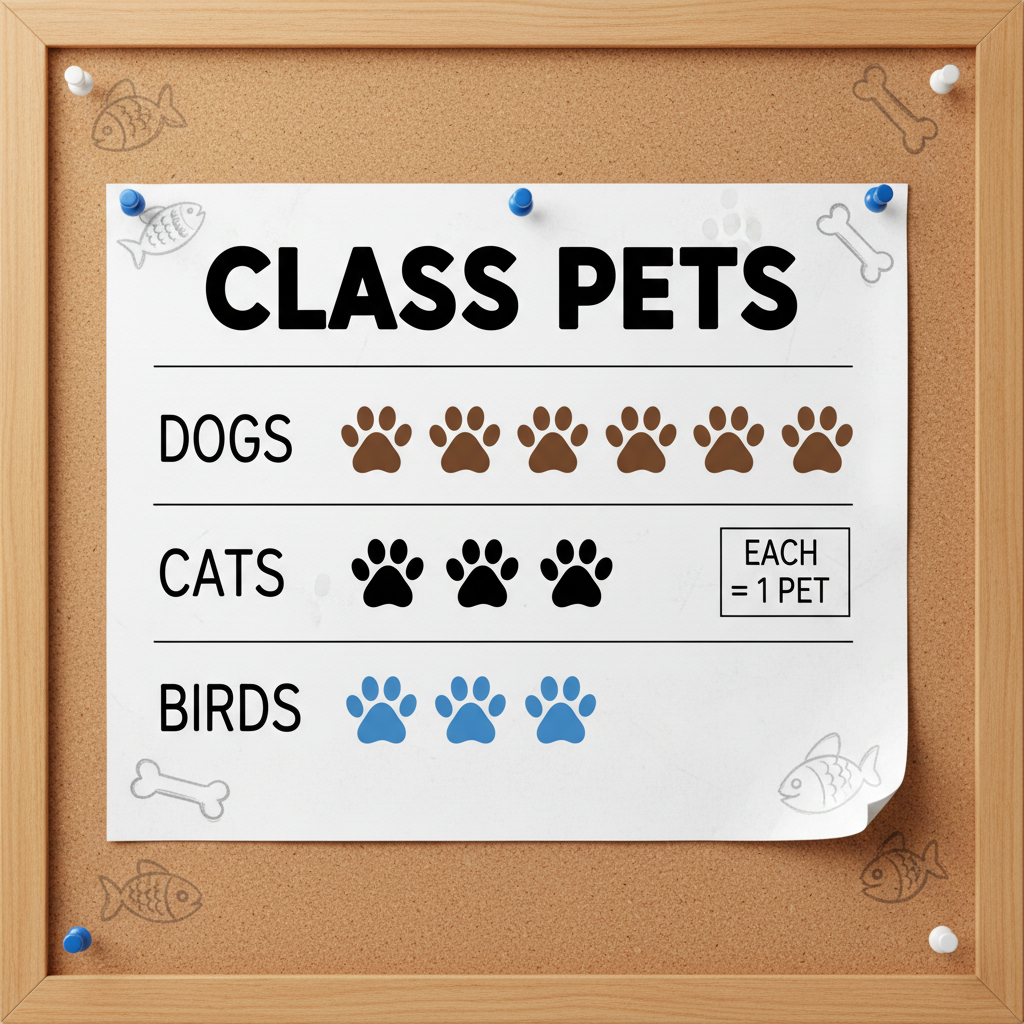
When the Key is More Than One!
Sometimes, you might have a lot of data, and using one symbol for just one item would mean drawing hundreds of pictures! That's not very fun. In these cases, we can make our symbol represent a larger number.
Let's say we asked 50 students about their favorite color, and here's what we found:
- Blue: 20 students
- Red: 15 students
- Green: 10 students
- Yellow: 5 students
If we used 1 symbol = 1 student, we'd have 20 symbols for blue! That's a lot.
Instead, let's try a key where: ⭐ = 5 students.
Now, let's see how many stars we need for each color:
- Blue: 20 students. Since each star is 5 students, we need 20 / 5 = 4 stars. ⭐⭐⭐⭐
- Red: 15 students. We need 15 / 5 = 3 stars. ⭐⭐⭐
- Green: 10 students. We need 10 / 5 = 2 stars. ⭐⭐
- Yellow: 5 students. We need 5 / 5 = 1 star. ⭐
Here's our new pictograph:
Favorite Colors of Students
Blue: ⭐⭐⭐⭐
Red: ⭐⭐⭐
Green: ⭐⭐
Yellow: ⭐
Key: ⭐ = 5 students
See? This is much neater! Remember, the key is what unlocks the meaning. Always check the key carefully!
Interpreting Pictographs
Once a pictograph is made, we can use it to answer questions. Think of it like solving a puzzle!
Using our "Favorite Colors" pictograph:
- Question: Which color is the most popular?
- Answer: Look for the color with the most stars. That's Blue with 4 stars!
- Question: How many more students like Blue than Yellow?
- Answer: Blue has 4 stars (4 x 5 = 20 students). Yellow has 1 star (1 x 5 = 5 students). So, 20 - 5 = 15 more students.
- Question: How many students were asked in total?
- Answer: Add up the students for each color: 20 (Blue) + 15 (Red) + 10 (Green) + 5 (Yellow) = 50 students. Or, add up the stars (4+3+2+1 = 10 stars) and multiply by the key value: 10 stars x 5 students/star = 50 students.
Key Takeaways
Let's quickly recap what we learned:
- A pictograph uses pictures or symbols to represent data, making information easy to see and understand.
- Every pictograph needs a title, labels, symbols, and a key.
- The key is crucial – it tells you what each symbol stands for (e.g., 1 symbol = 5 items).
- Pictographs help us compare data and tell stories with numbers.
Keep practicing, and you'll become a pictograph pro in no time!
Keep learning, free
Create a free Syllabax account to unlock practice questions and games for this topic.
Visual Learning Enhanced! 🚀
To help you master this topic, we use Advanced Syllabax AI to generate detailed diagrams and visual models.
Note on Visuals: The AI sometimes makes spelling errors in image labels. Please refer to the lesson text for the correct terminology.