Making Line Plots
Watch this topic in 60 seconds
Free preview · Lesson 1
Understanding Making Line Plots
Making Line Plots: Organizing Our Numbers!
Imagine you have a big pile of toys, and you want to know which toy you have the most of, or which toy is the tallest. If all your toys are jumbled together, it's hard to tell, right? But if you organize them by type or by height, suddenly it's much easier to see everything! That's exactly what a line plot helps us do with numbers!
What is a Line Plot?
A line plot is a special type of graph that helps us organize and show numbers in a very simple way. Think of it like a neatly organized shelf for your numbers! Instead of toys, we're organizing data (information) that we collect, usually numbers.
Imagine you've asked all your friends how many pets they have. You might get answers like: 1, 0, 2, 1, 3, 0, 1, 2, 1. Just looking at this list is a bit messy. A line plot helps us clean it up and see patterns, like "most friends have 1 pet" or "very few friends have 3 pets."
The Building Blocks of a Line Plot
A line plot has a few important parts, just like a building needs walls, a roof, and a floor.
1. The Number Line: Our Foundation!
The bottom part of a line plot is a straight line with numbers on it. This is called a number line. It's just like the ruler you use in school! A ruler helps you measure lengths, showing numbers like 1 inch, 2 inches, 3 inches. Our number line for a line plot does the same thing, but instead of measuring physical length, it shows the range of our data.
For example, if you're counting the number of pets, your number line might start at 0 and go up to 3 or 4, because no one has negative pets, and probably not 100 pets!
This number line is important because it gives a home for each piece of our data.
2. The Marks (Usually X's or Dots): Our Data Points!
Once you have your number line, you need to show your data on it. We do this by placing marks, usually an 'X' or a dot, above the numbers on the line. Each 'X' or dot stands for ONE piece of data.
Let's go back to our pet example: 1, 0, 2, 1, 3, 0, 1, 2, 1.
- For the first '1', you'd put an 'X' above the '1' on the number line.
- For the '0', you'd put an 'X' above the '0'.
- When you see another '1', you'd put another 'X' above the '1', right on top of the first 'X'.
Think of it like stacking building blocks! If three friends have 1 pet, you'd stack three 'X's above the number '1'. The taller the stack of X's, the more times that number appeared in your data!
3. The Title: What's This All About?
Just like a book needs a title to tell you what it's about, a line plot needs a title. This title tells everyone what kind of data is being shown. For our pet example, a good title would be "Number of Pets My Friends Have."
How to Make a Line Plot: Step-by-Step!
Ready to make your own line plot? It's like following a recipe!
Step 1: Gather Your Data! (What numbers do you have?)
First, you need the numbers you want to organize. Let's say you measure the length of 10 pencils (in inches) that your classmates have. Here are the measurements:
6 inches, 5 inches, 6 inches, 7 inches, 5 inches, 8 inches, 6 inches, 5 inches, 7 inches, 6 inches
Step 2: Draw Your Number Line! (The Ruler for Your Numbers)
Look at your data. What's the smallest number? (5 inches). What's the biggest number? (8 inches). Your number line needs to include all these numbers. So, draw a straight line and mark off numbers from 5 to 8, or even 4 to 9 to give it some space.
It's super important that the numbers on your line are equally spaced, just like on a ruler!
Step 3: Label Your Number Line! (What do these numbers mean?)
Below your number line, write what the numbers represent. In our pencil example, the numbers represent "Length of Pencil (in inches)."
Step 4: Plot Your Data with X's! (Stacking the Blocks)
Now, go through each number in your data one by one. For each number, put an 'X' (or a dot) above that number on your number line. If a number appears more than once, stack the 'X's one on top of the other.
Let's do our pencil data:
- 6 inches: X above 6
- 5 inches: X above 5
- 6 inches: Second X above 6
- 7 inches: X above 7
- 5 inches: Second X above 5
- 8 inches: X above 8
- 6 inches: Third X above 6
- 5 inches: Third X above 5
- 7 inches: Second X above 7
- 6 inches: Fourth X above 6
When you're done, you'll see stacks of X's above your number line.
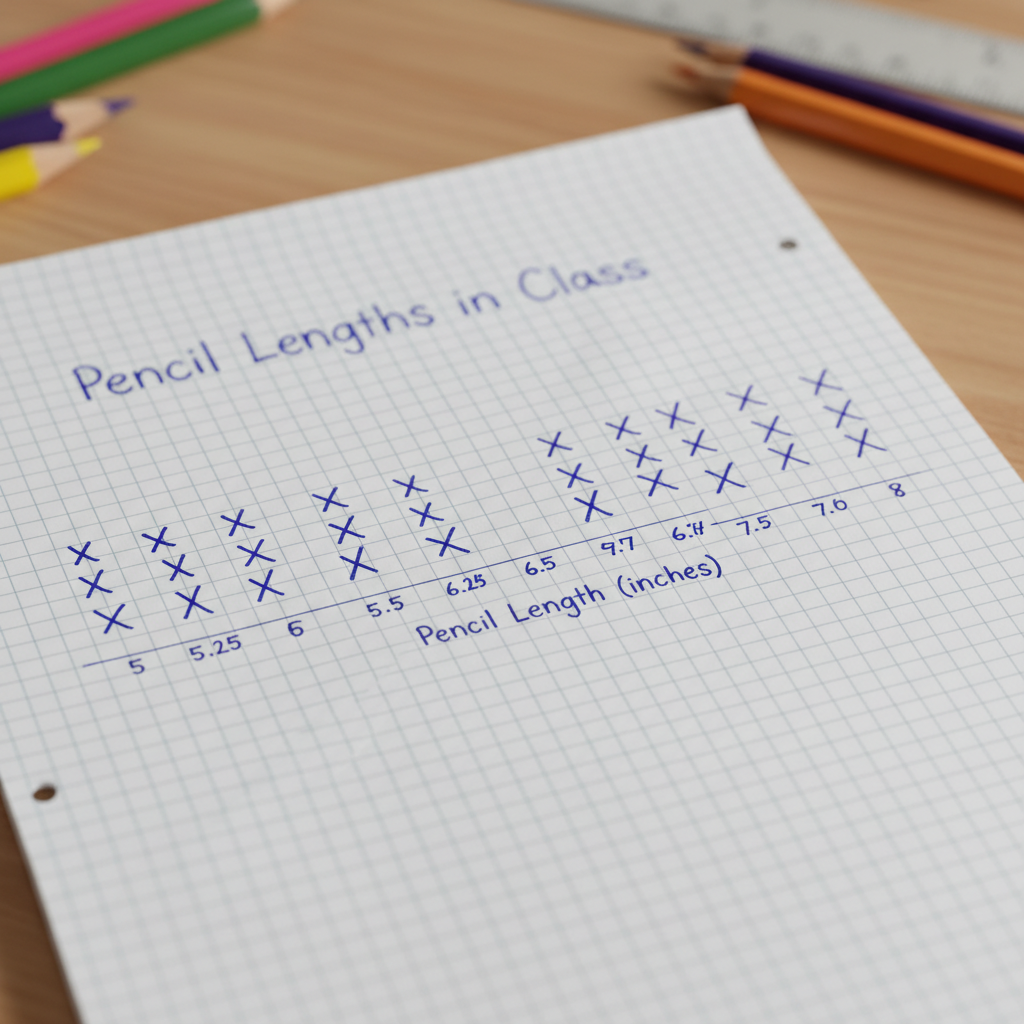 ⚠️ This picture may have spelling mistakes. Trust the words in the lesson.
Step 5: Give Your Line Plot a Title! (What's the Story?)
Finally, give your line plot a clear title. For our example, "Lengths of Pencils in Our Classroom" would be perfect.
Reading a Line Plot: What Can We Learn?
Once you've made a line plot, it's like opening your organized toy box – you can quickly see lots of things!
- Most Common (Mode): Which number has the tallest stack of X's? That's the most frequent answer or measurement in your data. In our pencil example, 6 inches has the tallest stack (4 X's), so 6 inches is the most common pencil length.
- Least Common: Which number has the shortest stack, or even no X's at all? That's the least frequent. In our pencil example, 8 inches only has one X, so it's one of the least common.
- How many total items? Just count all the X's! Each X is one piece of data. For the pencils, we have 10 X's, because we measured 10 pencils.
- Range: What's the difference between the biggest and smallest numbers with an X? Our smallest pencil was 5 inches, and the largest was 8 inches. The range is 8 - 5 = 3 inches.
Why Are Line Plots Useful?
Line plots make it easy to:
- See patterns in your data very quickly.
- Compare different numbers.
- Understand how numbers are spread out.
They are a simple but powerful tool for anyone who wants to make sense of numbers, from a 5th grader organizing pencil lengths to a scientist tracking plant growth!
Keep learning, free
Create a free Syllabax account to unlock practice questions and games for this topic.
Visual Learning Enhanced! 🚀
To help you master this topic, we use Advanced Syllabax AI to generate detailed diagrams and visual models.
Note on Visuals: The AI sometimes makes spelling errors in image labels. Please refer to the lesson text for the correct terminology.