Graphical representation: Bar graph (Statistics)
Watch this topic in 60 seconds
Free preview · Lesson 1
Understanding Graphical representation: Bar graph (Statistics)
Understanding Bar Graphs: A Visual Storyteller for Data
Welcome, future data detectives! Have you ever seen a chart with colorful blocks reaching different heights? That, my friends, is likely a bar graph! It's one of the simplest yet most powerful tools we use in a field called Statistics. Don't let the big word 'Statistics' scare you; it's simply the science of collecting, organizing, analyzing, interpreting, and presenting data. Think of data as pieces of information, like ingredients in a recipe. Statistics helps us make sense of those ingredients to understand what's cooking!
What is a Bar Graph? The Basics
Imagine you want to compare how many students in your class prefer apples, bananas, or oranges. You could list the numbers, but it might be hard to see at a glance which fruit is most popular. This is where a bar graph comes in handy!
A Bar Graph (also sometimes called a bar chart) is a way to show information visually using rectangular bars. These bars can be drawn either vertically (standing up like skyscrapers) or horizontally (lying down like logs). The length or height of each bar tells us the quantity or value of what it represents.
Why Do We Use Bar Graphs?
- Easy to Understand: They are super simple to read! Even a quick glance can tell you a lot. Imagine comparing the heights of people – it's much easier to see who's tallest than to read a list of their exact measurements.
- Great for Comparison: Bar graphs are champions at comparing different categories. You can instantly see which category has more, less, or is equal to others.
- Visual Appeal: They make data less boring and more engaging. Who wants to look at a spreadsheet full of numbers when you can see a colorful chart instead?
The Building Blocks of a Bar Graph: Like Parts of a House
Every good bar graph has several important parts that work together to tell a complete story. Let's explore them:
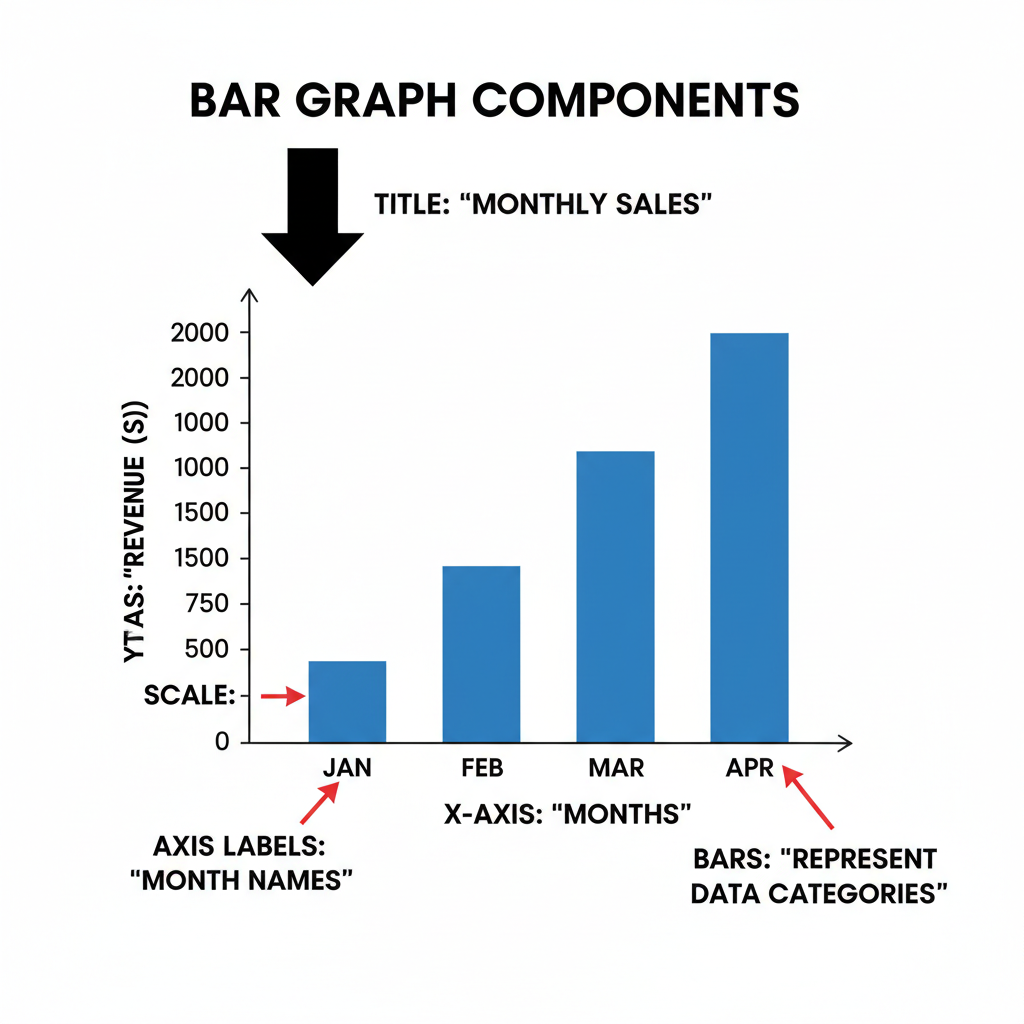
1. Title: The Name of the Story
Just like every book needs a title to tell you what it's about, every bar graph needs a Title. The title is usually at the top and clearly explains what the graph is showing. For example, 'Favorite Fruits of Grade 9 Students'. Without a title, you wouldn't know what story the bars are trying to tell!
2. Axes: The Framework
A bar graph has two main lines, like the frame of a window: the X-axis and the Y-axis.
- X-axis (Horizontal Axis): This is the line that runs flat, left to right, along the bottom of the graph. It's where you list the categories or types of things you are comparing. Think of it as where you put the labels for your 'ingredients' – like 'Apples', 'Bananas', 'Oranges'.
- Y-axis (Vertical Axis): This is the line that runs straight up and down, along the side of the graph. It's where you show the numerical values or amounts. This axis usually starts at zero and goes upwards. Think of it as your 'measuring cup' or 'ruler' that tells you 'how many' or 'how much'. It might be labeled 'Number of Students', 'Sales', 'Height', etc.
3. Labels for Axes: Explaining the Framework
Each axis needs a clear label to tell you what it represents. The X-axis might be labeled 'Fruit Types' and the Y-axis might be labeled 'Number of Students'. Without these labels, the axes are just lines, and you won't know what they're measuring!
4. Scale: The Ruler for Your Measurements
The Y-axis (the vertical one) has a scale. This is like the markings on a ruler or the numbers on a thermometer. It tells you what each line or increment represents (e.g., each line represents 1 student, 5 students, or 10 students). Choosing the right scale is important so your bars fit nicely and accurately represent the data. If your numbers range from 0 to 100, you wouldn't count by ones; you might count by tens or twenties.
5. Bars: The Visual Data
Finally, the stars of the show! The bars are the rectangular blocks that rise from the X-axis (or extend from the Y-axis if horizontal). Each bar represents a specific category from the X-axis, and its height (or length) corresponds to its value on the Y-axis. The bars in a bar graph are typically separated by a small gap to show that they represent distinct categories, unlike a histogram where bars touch.
Here's a visual to help you put all these pieces together:
 ⚠️ This picture may have spelling mistakes. Trust the words in the lesson.
Types of Bar Graphs
While the basic idea is the same, bar graphs can be displayed in two main ways:
- Vertical Bar Graph: The most common type, where bars stand upright, and their height shows the value. Think of skyscrapers!
- Horizontal Bar Graph: Less common but useful when category names are very long. The bars lie sideways, and their length shows the value. Think of logs lying on the ground!
How to Create a Simple Bar Graph (Step-by-Step)
Let's use our fruit example:
Data: Apples: 8 students, Bananas: 12 students, Oranges: 5 students.
- Collect Your Data: First, you need the numbers! (Done: 8, 12, 5).
- Draw Your Axes: Draw a horizontal line (X-axis) and a vertical line (Y-axis) that meet at a corner.
- Label the X-axis: Write the categories along the X-axis. In our case: 'Apples', 'Bananas', 'Oranges'. Make sure to leave space between where your bars will go.
- Label the Y-axis and Choose a Scale: Decide what your numbers represent ('Number of Students'). Look at your data (5, 8, 12). The highest is 12. A good scale might count by 2s (0, 2, 4, 6, 8, 10, 12, 14) to give some room. Mark these numbers along the Y-axis, starting from 0 at the bottom.
- Draw the Bars: For each category on the X-axis, draw a rectangular bar upwards until its top edge reaches the value on the Y-axis that corresponds to your data.
- For Apples: Draw a bar up to 8 on the Y-axis.
- For Bananas: Draw a bar up to 12 on the Y-axis.
- For Oranges: Draw a bar up to 5 on the Y-axis (you'll estimate halfway between 4 and 6).
- Add a Title: Give your graph a clear title, like 'Favorite Fruits of Grade 9 Students'.
Reading and Interpreting a Bar Graph
Reading a bar graph is like reading a story. Here's how:
- Read the Title: What is the graph about?
- Look at the Axis Labels: What are the categories being compared (X-axis)? What are the values being measured (Y-axis)?
- Check the Scale: What do the numbers on the Y-axis represent? How much does each line or block count for?
- Examine the Bars: Compare the heights (or lengths) of the bars.
- Which bar is the tallest? That represents the category with the highest value.
- Which bar is the shortest? That represents the category with the lowest value.
- Are any bars similar in height? Those categories have similar values.
- Draw Conclusions: What story does the graph tell you? (e.g., 'Bananas are the most preferred fruit, and oranges are the least preferred among Grade 9 students.')
Common Mistakes to Avoid
- No Title: A graph without a title is like a book without a cover – confusing!
- Missing Axis Labels: Don't make people guess what your axes represent.
- Incorrect Scale: Make sure your scale is consistent (e.g., counting by 2s consistently) and allows all your data to fit without making the graph too squished or too empty.
- Unequal Bar Widths: All bars should be the same width. Only their height/length should vary.
- Bars Touching (in a simple bar graph): Remember, bars in a bar graph represent distinct categories and should have gaps between them.
Congratulations! You've just taken your first big step into the world of graphical representation. Bar graphs are fundamental tools that help us see patterns, make comparisons, and understand data much more easily than looking at a jumble of numbers. Keep practicing, and you'll soon be a master data storyteller!
Keep learning, free
Create a free Syllabax account to unlock practice questions and games for this topic.
Visual Learning Enhanced! 🚀
To help you master this topic, we use Advanced Syllabax AI to generate detailed diagrams and visual models.
Note on Visuals: The AI sometimes makes spelling errors in image labels. Please refer to the lesson text for the correct terminology.