Logical inference from charts – Data Interpretation (Intermediate)
Watch this topic in 60 seconds
Free preview · Lesson 1
Logical inference from charts – Data Interpretation (Intermediate) (Foundational)
Data Interpretation: Making Smart Guesses from Charts!
Hey there, future data detectives! Ever looked at a chart and wondered what it all means? That's data interpretation! It's like reading a story written with numbers and pictures. We're going to learn how to make logical guesses, or inferences, from those charts.
What is Data Interpretation?
Data interpretation is the process of looking at information (data) presented in charts, graphs, and tables, and figuring out what it means. It's about understanding the 'story' the data is trying to tell you!
Types of Charts We'll See
- Bar Chart: Uses bars to show amounts of different things. Taller bars mean more!
- Pie Chart: A circle divided into slices. Each slice shows a part of the whole. Bigger slices mean a bigger part!
- Line Graph: Uses a line to show how something changes over time. The line going up means it's increasing!

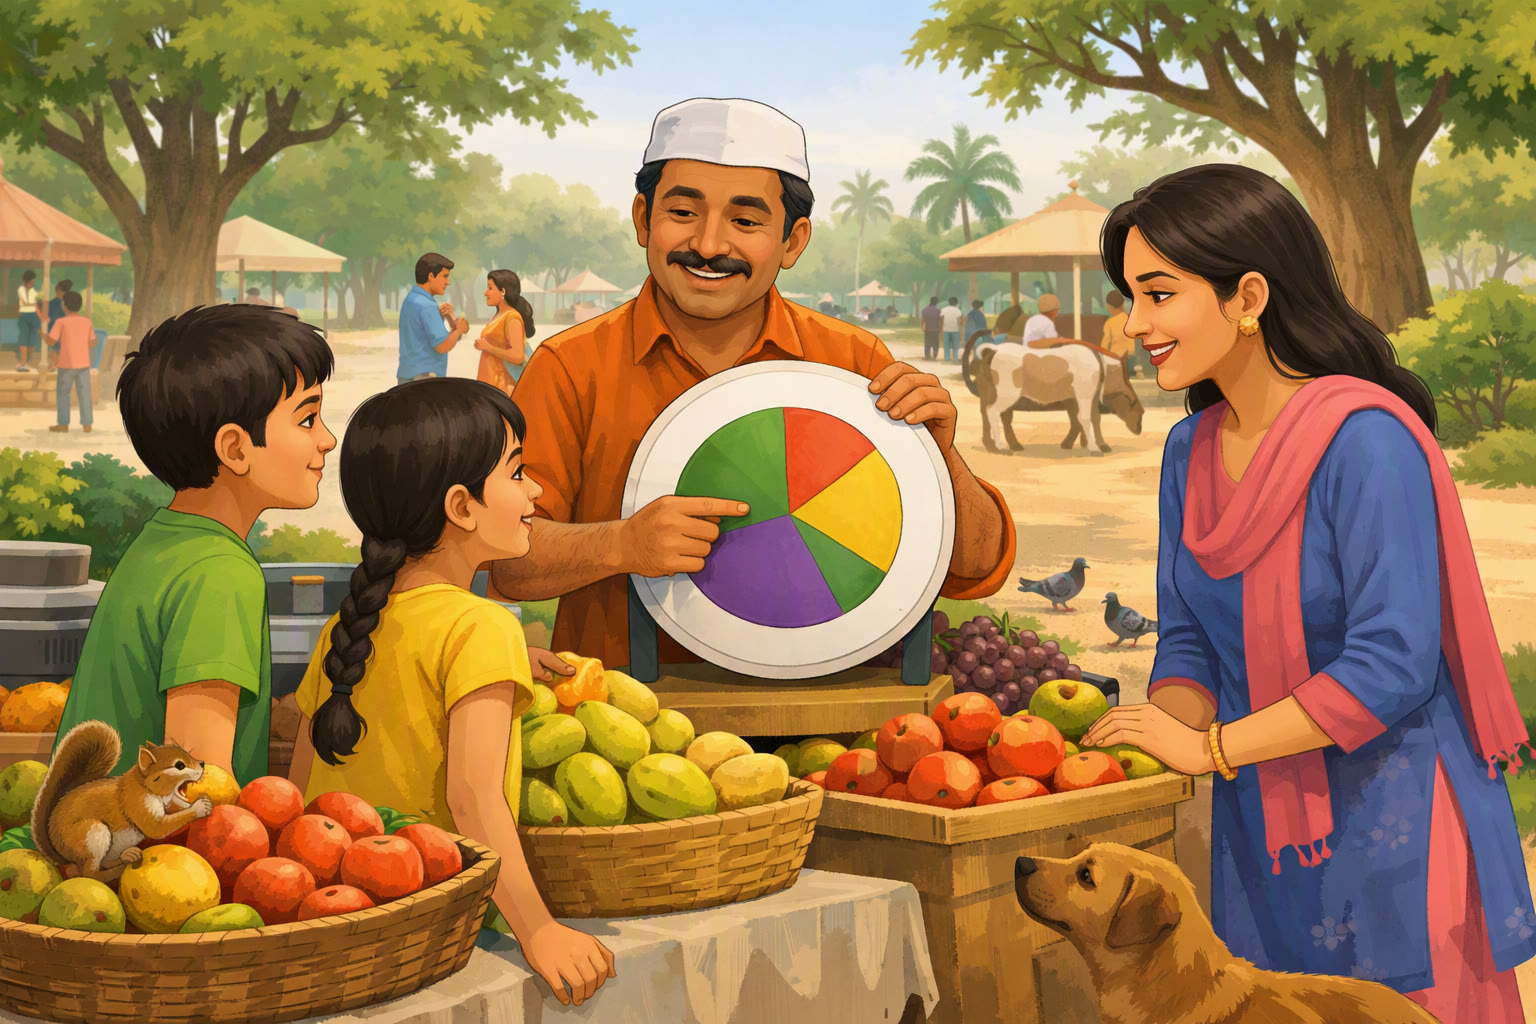
Making Logical Inferences
Now, let's talk about inferences. An inference is like a smart guess based on the information you have. Here's how to make them from charts:
- Look Closely: Pay attention to the labels, titles, and numbers on the chart. What is it showing?
- Find Patterns: Are the bars getting taller? Is the line going up or down? This tells you about trends.
- Make a Guess: Based on the patterns, what do you think is happening? This is your inference!
Example:
Imagine a bar chart showing the number of students who like different fruits. If the bar for 'Apples' is the tallest, we can infer that more students like apples than any other fruit shown in the chart.
Key Vocabulary:
- Data: Information, often in the form of numbers.
- Chart: A visual way to show data (like a bar chart or pie chart).
- Inference: A smart guess based on information.
- Trend: A pattern in the data (like something increasing or decreasing).
Remember, data interpretation is a skill that gets better with practice. So, keep looking at charts and making those smart guesses!
Keep learning, free
Create a free Syllabax account to unlock practice questions and games for this topic.
Visual Learning Enhanced! 🚀
To help you master this topic, we use Advanced Syllabax AI to generate detailed diagrams and visual models.
Note on Visuals: The AI sometimes makes spelling errors in image labels. Please refer to the lesson text for the correct terminology.