Learning Journey
Watch this topic in 60 seconds
Free preview · Lesson 1
Understanding Case-based data problems [Data Interpretation (HOTS)]
Case-Based Data Problems: Unlocking the Story Behind the Numbers (Grade 8)
Welcome, future data detectives! Get ready to explore the exciting world of Case-Based Data Problems. Imagine you're a super-sleuth, and instead of solving a mystery with footprints and fingerprints, you're solving problems using information, facts, and numbers! This isn't just about memorizing facts; it's about putting on your thinking cap and understanding what those facts *really* mean.
Analogy Alert!
Think of data problems like a giant jigsaw puzzle. Each piece of data is a puzzle piece. A 'case' is the picture you're trying to build. And 'data interpretation' is the act of putting those pieces together to see the whole picture and understand what it shows!What is Data? The Building Blocks of Information
At its heart, data is simply information. It can be anything from numbers (like how many students prefer pizza) to words (like comments about a new school policy). It's the raw material, the ingredients we use to understand a situation.
- Numbers: These are quantities or measurements, like the number of goals scored by a soccer team, the temperature outside, or the cost of a movie ticket.
- Categories/Descriptions: These describe qualities or groups, like favorite colors (red, blue, green), types of pets (dog, cat, fish), or opinions (good, bad, neutral).
Analogy Alert!
Imagine you're baking a cake. Flour, sugar, eggs, and milk are your 'data'. They are individual ingredients. You can't just eat the flour by itself and say you've had a cake, right? You need to mix them, bake them, and turn them into something delicious. That's what we do with data!What is a 'Case'? The Story You Need to Understand
A case is a specific situation, a scenario, or a problem that we need to understand or solve. It's like a story with missing parts, and the data provides the clues to fill in those blanks. A case might be about:
- A school trying to decide which new sports equipment to buy.
- A store wanting to know why some products sell better than others.
- A city planning how to improve traffic flow.
The case gives context to the data. Without a case, data is just a bunch of random facts. The case tells you *why* you're looking at the data.
What is Data Interpretation? Making Sense of the Clues
Data interpretation is the process of reviewing data and arriving at conclusions. It means figuring out what the data tells you, finding patterns, and making informed decisions or predictions. It's not just seeing the numbers; it's understanding the *message* hidden within them.
Analogy Alert!
Think about a secret code. The letters and symbols are the 'data'. 'Data interpretation' is like breaking that code to understand the secret message. You're not just reading the symbols; you're understanding what they mean together.HOTS: Higher-Order Thinking Skills – Beyond Just Knowing
The 'HOTS' in 'Case-based data problems (HOTS)' stands for Higher-Order Thinking Skills. This means you're not just recalling information (like remembering a definition). Instead, you're using skills like:
- Analyzing: Breaking down information into smaller parts to understand how they relate.
- Evaluating: Judging the value or significance of information, making decisions.
- Synthesizing: Combining different pieces of information to create something new or a new understanding.
- Problem-Solving: Using data to figure out solutions to real-world challenges.
When you solve case-based data problems, you're becoming a true critical thinker!
Key Idea!
Solving these problems is like being a detective. You collect clues (data), examine them carefully (analyze), figure out what they mean (interpret), and then solve the mystery (answer the case problem).Your Detective Toolkit: Steps to Solve Case-Based Data Problems
Here are the essential steps you'll follow to crack any data case. Master these, and you'll be a data pro in no time!
-
1. Understand the Case: What's the Story?
Action: Read the entire problem carefully. What is the main question being asked? What is the situation? What are you trying to figure out?
Think of it like reading the instructions for a board game. You need to know the goal of the game before you start playing! -
2. Identify the Data: What Information Do You Have?
Action: Look at all the numbers, charts, graphs, and text provided. What specific pieces of information are given? What are the labels? What do the numbers represent?
This is like finding all the pieces of your jigsaw puzzle. Are they numbers? Words? Pictures? -
3. Organize and Explore the Data: Make Sense of the Pieces
Action: If the data is messy, try to organize it. Can you put it into a simple table? Can you highlight important numbers? Look for obvious patterns or extreme values (the highest, the lowest).
Imagine sorting your Lego bricks by color or size. It makes it much easier to find the piece you need later! -
4. Analyze the Data: Connect the Dots!
Action: This is where the real thinking happens! Look for relationships between different pieces of data. Are numbers increasing or decreasing? Are there any groups that stand out? Compare different categories. Do simple calculations if needed (like finding a total or an average).
Now you're starting to fit the puzzle pieces together. You see a blue piece and another blue piece, and realize they might be part of the sky. You start to see how different parts connect.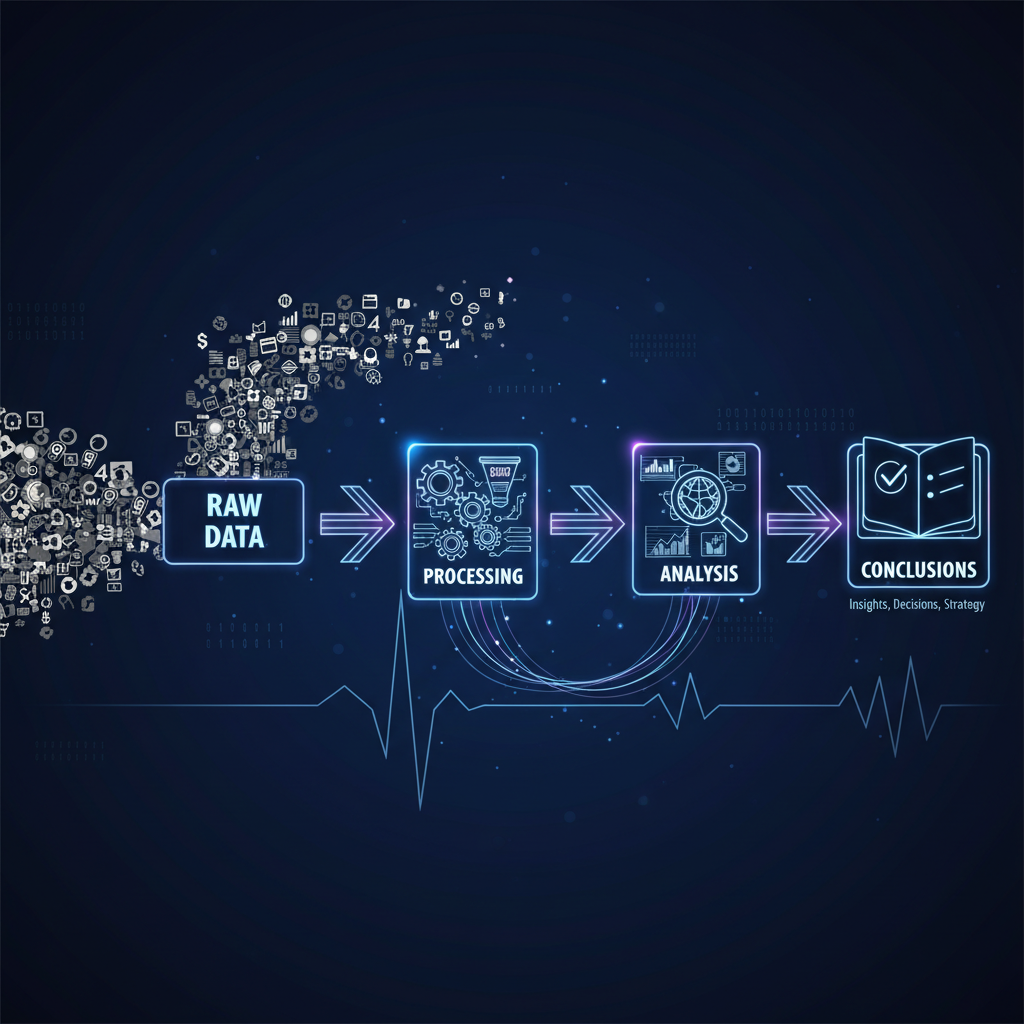
Fig 1: The journey of raw data to meaningful conclusions.
-
5. Interpret and Conclude: What Does It All Mean?
Action: Based on your analysis, answer the questions posed in the case. Explain your findings clearly. What story does the data tell? What decisions can be made?
The puzzle is complete! You can now clearly see the beautiful picture and explain what it is to someone else. You've solved the mystery! -
6. Check Your Work: Does Your Answer Make Sense?
Action: Read your answer and compare it to the original question and the data. Did you answer everything? Is your conclusion logical and supported by the data?
Before you hand in your test, you quickly look over your answers. Did you make any silly mistakes? Is everything clear?
Mini-Case Example: School Fundraiser
Case: The 8th Grade class is planning a fundraiser to buy new books for the library. They sold three types of items: cookies, lemonade, and handmade cards. They want to know which item was most popular and how much money they raised in total to see if they met their goal of $200.
Data Provided:
- Cookies: 50 sold at $2 each
- Lemonade: 30 sold at $1.50 each
- Handmade Cards: 25 sold at $3 each
Let's Apply the Steps:
- Understand the Case: The goal is to find the most popular item, the total money raised, and if they reached $200.
- Identify the Data: We have sales numbers (50, 30, 25) and prices (
- Organize and Explore:
- Cookies: 50 items
- Lemonade: 30 items
- Cards: 25 items
- Analyze the Data:
- Money from Cookies: 50 x
- Money from Lemonade: 30 x
- Money from Cards: 25 x
- Total Money Raised:
- Money from Cookies: 50 x
- Interpret and Conclude:
- Most Popular Item (by quantity sold): Cookies (50 sold).
- Total Money Raised: $220.
- Goal Achieved? Yes, they raised
- Check Your Work: The calculations seem correct, and the answers directly address the questions asked in the case.
Why Are These Skills Important for YOU?
Learning to solve case-based data problems isn't just for tests; it's a life skill! You'll use these skills when:
- Deciding which phone to buy based on features and price.
- Understanding news articles that show charts about climate change or election results.
- Planning a budget for a school project or your allowance.
- Even figuring out which video game to play based on reviews and ratings!
By becoming skilled at data interpretation, you become a more informed, critical, and powerful thinker. Keep practicing, and you'll soon be uncovering stories and solutions hidden in plain sight!
Keep learning, free
Create a free Syllabax account to unlock practice questions and games for this topic.
Visual Learning Enhanced! 🚀
To help you master this topic, we use Advanced Syllabax AI to generate detailed diagrams and visual models.
Note on Visuals: The AI sometimes makes spelling errors in image labels. Please refer to the lesson text for the correct terminology.