Bar Graphs: Reading & Making
Watch this topic in 60 seconds
Free preview · Lesson 1
Understanding Bar Graphs: Reading & Making
Bar Graphs: Reading & Making – Your Visual Data Storytellers!
Welcome, 8th graders, to the exciting world of data visualization! Imagine you have a pile of LEGOs, all mixed up. It's hard to see how many red ones, blue ones, or yellow ones you have, right? Now, imagine you sort them into separate bins, one for each color. Suddenly, it's easy to see which color you have the most of and which you have the fewest of! That's exactly what a bar graph does for numbers – it takes messy data and organizes it so you can see patterns and make comparisons easily.
In this lesson, we're going to become experts at both reading bar graphs (understanding the stories they tell) and making them (telling our own data stories).
What is a Bar Graph? The Basics of Visual Data
At its heart, a bar graph is a chart that uses rectangular bars to show and compare different amounts of things. Think of them like little skyscrapers or towers, where the height (or sometimes the length) of each tower tells you how 'big' that category is. The taller the bar, the larger the number or amount it represents.
Analogy: Imagine you're comparing the heights of your friends. You could just list their heights, but it's much clearer if they all stand in a line and you can visually see who is tallest and who is shortest. A bar graph does this for numbers!
The Essential Parts of Every Bar Graph (Anatomy Lesson!)
Every good bar graph has specific parts that help us understand the data it's showing. Let's break them down:
1. The Title: The 'Headline' of Your Graph
- The title is usually at the top of the graph and tells you exactly what the graph is about. It's like the headline of a newspaper article – it gives you the main idea instantly.
- Analogy: If a book didn't have a title, you wouldn't know if it's about space travel, dinosaurs, or cooking! The title tells you the graph's subject.
2. The Axes: Your Graph's 'Roads'
Bar graphs have two main lines, called axes (pronounced AX-eez). Think of them as the main roads on a map that help you locate things.
- The X-Axis (Horizontal Axis): The 'Category' Road
- This is the line that runs flat, from left to right, along the bottom of the graph.
- It usually shows the categories or types of things you are comparing. These are often words, not numbers.
- Analogy: If you're graphing favorite colors, the X-axis would list 'Red', 'Blue', 'Green', etc. These are your categories.
- The Y-Axis (Vertical Axis): The 'Value' Road
- This is the line that runs straight up and down, along the left side of the graph.
- It usually shows the values or amounts related to each category. These are always numbers.
- Analogy: If you're counting how many people like each color, the Y-axis would show numbers like 0, 1, 2, 3, and so on, representing the number of people.
3. Axis Labels: Naming the Roads
- Each axis needs a label to tell you what it's measuring. For example, the X-axis might be labeled 'Favorite Fruit', and the Y-axis might be labeled 'Number of Students'.
- Without labels, the axes are just lines! They wouldn't make sense.
4. The Scale: Your Graph's 'Ruler'
- The scale is the set of numbers along the Y-axis (the vertical axis). It tells you what each line or increment on the Y-axis represents.
- It's crucial for accurately reading the height of the bars. The numbers must go up in equal steps (like 0, 5, 10, 15, or 0, 10, 20, 30).
- Analogy: Imagine a ruler. If a ruler skipped numbers (0, then 5, then 7, then 10), it would be impossible to measure accurately. A graph's scale must be consistent!
5. The Bars: The 'Skyscrapers' of Data
- These are the rectangles that go up from the X-axis (or sometimes sideways from the Y-axis).
- The height (or length) of each bar directly corresponds to the value it represents on the Y-axis.
- The bars are usually separated by a small gap to show they are distinct categories.
- Analogy: Each bar is like a tower, and its height tells you how important or numerous its category is. The taller the tower, the bigger the number!
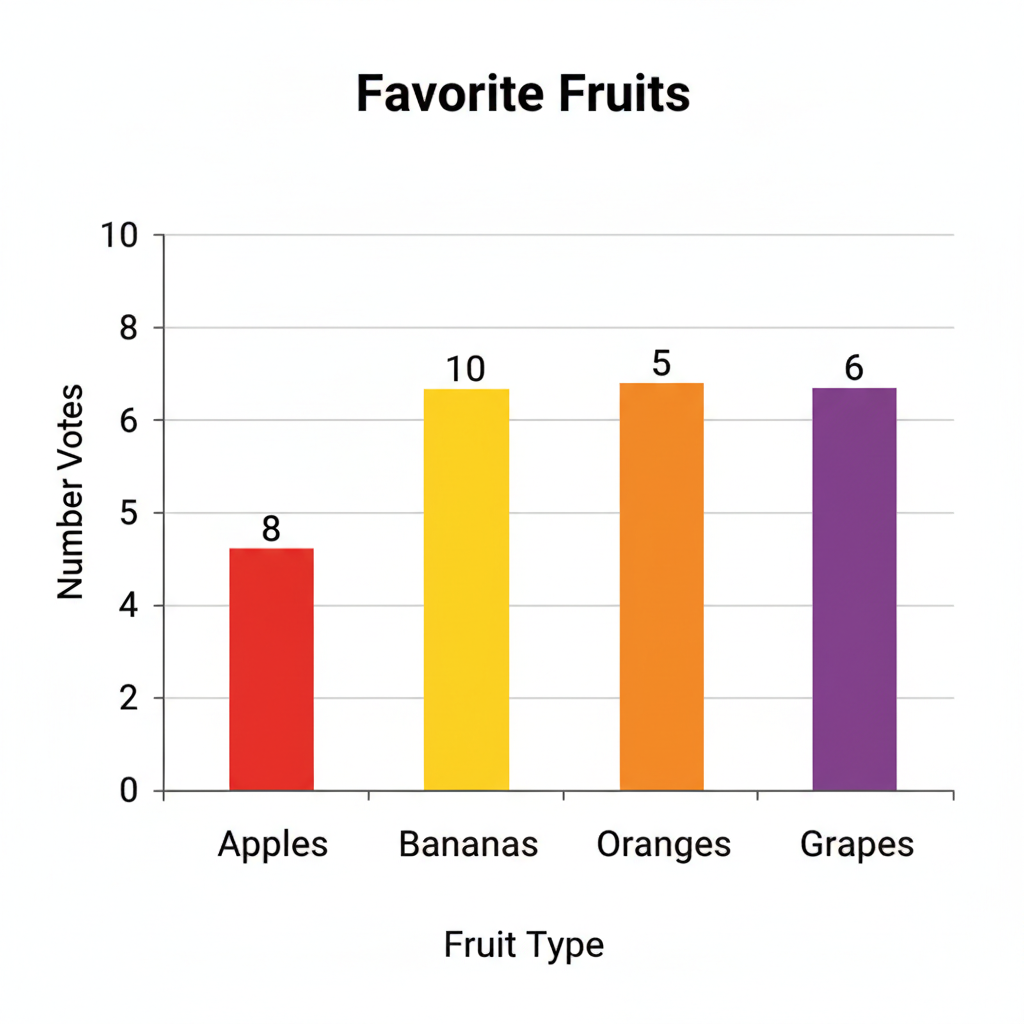
Here's an example of what a bar graph looks like with all its parts:
Reading a Bar Graph: Decoding the Data Story
Reading a bar graph is like being a detective, looking for clues to understand the data. Follow these steps:
- Read the Title First: This gives you the main topic. What story is this graph trying to tell?
- Look at the Axis Labels: What do the X-axis and Y-axis represent? What categories are being compared, and what unit are the values measured in?
- Examine the Scale: How much does each line or interval on the Y-axis represent? Is it counting by 1s, 5s, 10s, or something else? This is crucial for accuracy.
- Find the Bar You're Interested In: Locate the category on the X-axis.
- Read the Bar's Value: Follow the top of that bar straight across to the Y-axis. The number it lines up with is its value. If it falls between two numbers, estimate carefully based on the scale.
- Compare Bars: Once you've read a few values, you can compare them. Which bar is tallest (highest value)? Which is shortest (lowest value)? Are any bars the same height?
Analogy: Reading a bar graph is like looking at a lineup of people and quickly figuring out who's the tallest, who's the shortest, and what each person's exact height is by checking a measuring tape next to them.
Making a Bar Graph: Creating Your Own Data Story
Now that you know how to read them, let's learn how to make one! It's like building your own LEGO model following instructions.
- Collect Your Data: First, you need data! This could be the number of students who like different sports, the types of pets your classmates have, or the scores from a recent quiz.
- Identify Categories and Values: Decide what goes on the X-axis (your categories, like 'Soccer', 'Basketball', 'Tennis') and what goes on the Y-axis (your values, like 'Number of Students').
- Draw Your Axes: Use a ruler to draw a horizontal line (X-axis) and a vertical line (Y-axis) that meet at a right angle. The meeting point is usually 0.
- Label Your Axes: Write the labels for what each axis represents (e.g., 'Sport' for the X-axis, 'Number of Students' for the Y-axis). Don't forget the individual category names along the X-axis!
- Choose and Mark Your Scale: Look at your highest data value. Your Y-axis scale needs to go at least as high as your highest value, and it needs to go up in equal increments (e.g., 0, 2, 4, 6... or 0, 5, 10, 15...). Mark these numbers evenly along the Y-axis.
- Draw Your Bars: For each category, draw a rectangular bar. The bottom of the bar should be on the X-axis, and its height should reach the correct value on the Y-axis. Make sure your bars are all the same width and have equal spacing between them.
- Add a Title: Give your graph a clear, descriptive title that tells everyone what the data is about (e.g., 'Favorite Sports of 8th Graders').
Analogy: Making a bar graph is like baking a cake. You need all the right ingredients (data, labels, scale), mix them together in the right order (draw axes, choose scale), and present it nicely (draw bars, add title) so everyone can enjoy it!
Why Use Bar Graphs?
- Easy Comparisons: They make it super easy to compare different categories at a glance.
- Clear Visuals: Complex numbers become simple visual stories.
- Identify Trends: You can quickly see which category is popular, which is less popular, or if there are any surprising results.
Bar graphs are powerful tools for understanding the world around you, from school surveys to scientific data and even news reports. Master them, and you'll master an important skill for life!
Keep learning, free
Create a free Syllabax account to unlock practice questions and games for this topic.
Visual Learning Enhanced! 🚀
To help you master this topic, we use Advanced Syllabax AI to generate detailed diagrams and visual models.
Note on Visuals: The AI sometimes makes spelling errors in image labels. Please refer to the lesson text for the correct terminology.