Learning Journey
Free preview · Lesson 1
Understanding Reading Picture Graphs
Welcome to the Wonderful World of Picture Graphs!
Hey Super Scientists and Awesome Artists! Have you ever wanted to count things in a really fun way? Like, how many red apples are in your fruit bowl, or how many of your friends like to play tag? Well, today we're going to learn about a super cool tool called a Picture Graph! Think of a picture graph like a special storybook where pictures tell you all about numbers and how many of something there is.
What is a Picture Graph?
Imagine you're collecting stickers. Instead of just writing down "I have 5 car stickers," you could draw 5 little car pictures! A picture graph does something very similar. It uses pictures or symbols to show how many of different things you have. It's a visual way to count, which means you can see the numbers with your eyes!
Analogy: Think of it like this: If you wanted to show your friend how many sunny days you had last week, instead of saying "there were 4 sunny days," you could draw 4 little suns! A picture graph is just a very organized way to do that for many different things.
The Super Important Parts of a Picture Graph
Every good storybook has different parts, like a title, characters, and an ending. A picture graph also has important parts that help us understand the 'story' it's telling.
1. The Title: What's Our Story About?
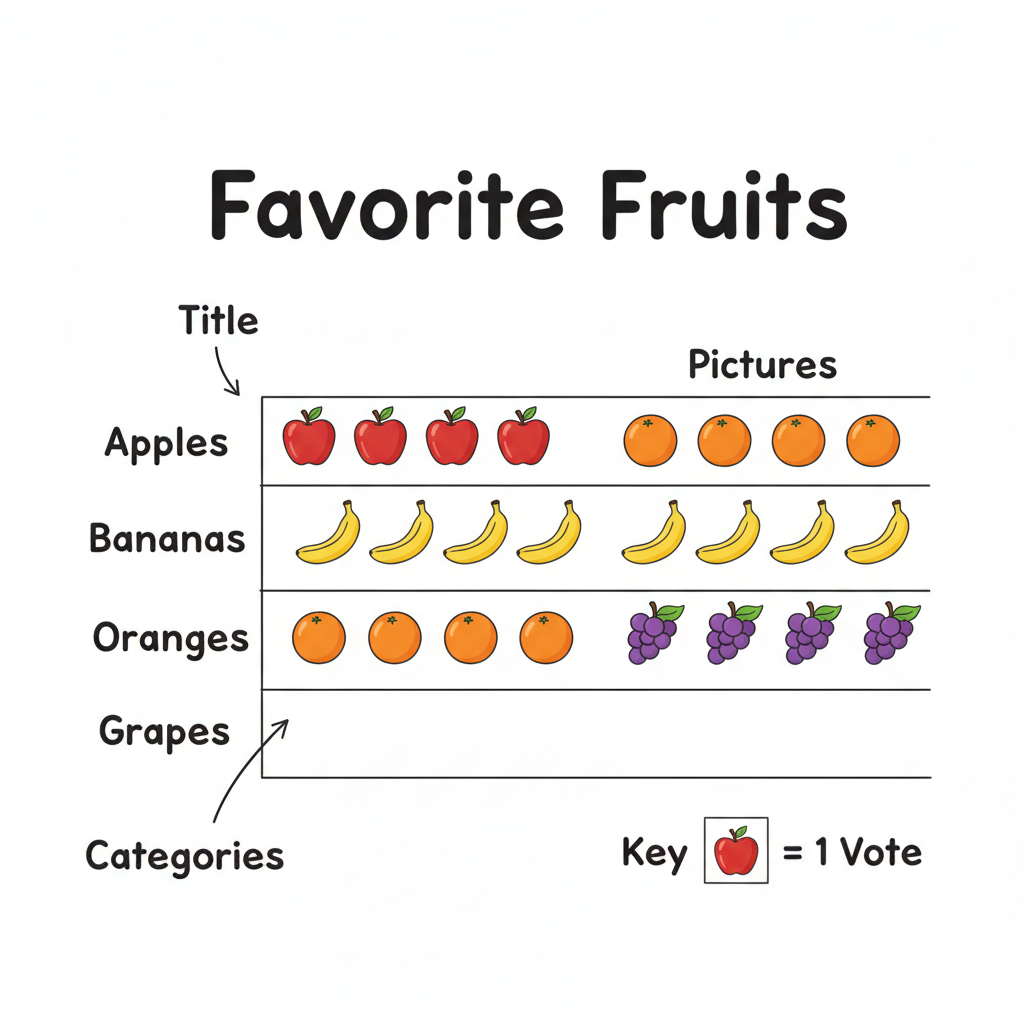
Just like a book has a title that tells you what the book is about (like "The Very Hungry Caterpillar"), a picture graph has a Title. The title tells you what information you're going to find in the graph. For example, a title might be "Our Favorite Fruits" or "Pets in Our Class."
Analogy: The title is like the big sign on top of a store that tells you what kind of things you can buy inside!
2. Categories or Labels: Who are the Characters?
In our graph story, the Categories (sometimes called Labels) are the different things we are counting. If the title is "Our Favorite Fruits," the categories might be "Apples," "Bananas," "Oranges," and "Grapes." Each category usually has its own row or column.
Analogy: If you're sorting your toys, the categories are like the different boxes you put them in: one box for cars, one for blocks, one for dolls.
3. Pictures or Symbols: The Special Counters!
These are the actual drawings on the graph! They are the Pictures or Symbols that stand for the items we are counting. If we're counting "Our Favorite Fruits," you might see little pictures of apples, bananas, oranges, and grapes.
Analogy: These pictures are like the tally marks you make when you're counting, but instead of lines, they are cute little drawings!
4. The Key: The Secret Code! (THE MOST IMPORTANT PART!)
This is where picture graphs get really clever and sometimes a little tricky, but it's super important! The Key (or Legend) is like a secret code or a rule book. It tells you what EACH picture stands for. Sometimes one picture means 1 item. But sometimes, one picture means 2 items, or 5 items, or even 10 items! You MUST always look at the key first.
Analogy: Imagine you're playing a game, and one gold coin is worth 5 regular coins. The key is like the game's rule that tells you that one gold coin isn't just one coin, it's worth 5! If you don't read the key, you might count wrong!
How to Read a Picture Graph: Step-by-Step Detective Work!
Reading a picture graph is like being a detective and solving a mystery! Here’s how you do it:
- Step 1: Read the Title. What is this graph all about? This gives you the big picture.
- Step 2: Look at the Categories. What different things are being counted or compared?
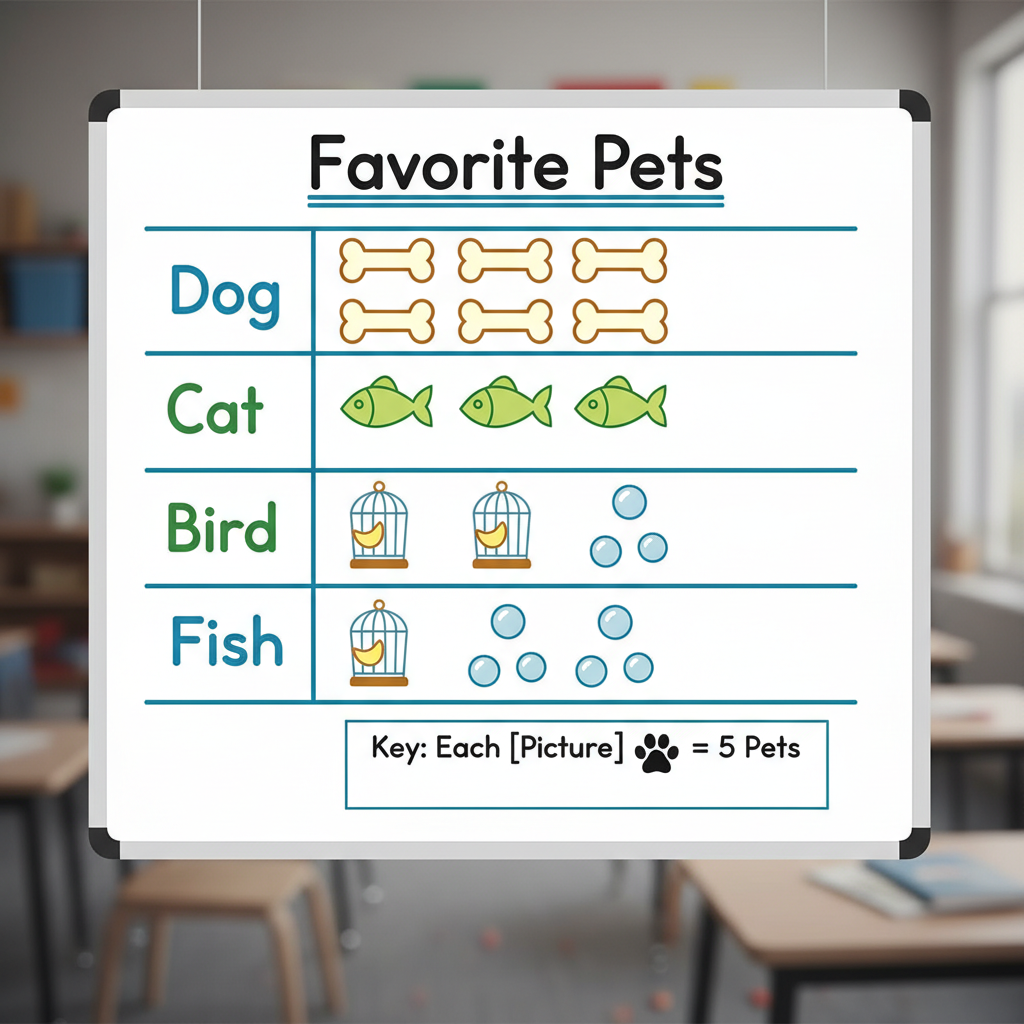
- Step 3: FIND AND READ THE KEY! This is the most crucial step! Find the little box or sentence that says, "Each = X items." This tells you how much each picture is worth. If you skip this, you might get the wrong answer!
- Step 4: Count the Pictures (using the Key!). For each category, count how many pictures there are. Then, multiply that number by what the key says each picture is worth.
- Step 5: Answer the Questions! Now you have all the information to answer questions about the graph!
Let's Try an Example!
Imagine a graph showing "Favorite Colors in Class 3B":
Key: Each happy face 😊 = 2 students
- Red: 😊 😊 😊
- Blue: 😊 😊 😊 😊
- Green: 😊 😊
Let's use our detective steps:
- Title: "Favorite Colors in Class 3B" (Okay, we're talking about colors students like.)
- Categories: Red, Blue, Green (These are the specific colors.)
- Key: Each happy face 😊 = 2 students (Aha! Each picture means 2 people!)
- Count Pictures (using the Key):
- Red: There are 3 happy faces. Since each face is 2 students, that's 3 x 2 = 6 students.
- Blue: There are 4 happy faces. That's 4 x 2 = 8 students.
- Green: There are 2 happy faces. That's 2 x 2 = 4 students.
Now we can answer questions like:
- How many students like Red? 6 students.
- Which color is liked by the most students? Blue (8 students).
- How many more students like Blue than Green? 8 - 4 = 4 students.
- How many students were asked altogether? 6 + 8 + 4 = 18 students.
 ⚠️ This picture may have spelling mistakes. Trust the words in the lesson.
Practice Makes Perfect!
The more you practice reading the title, categories, and especially the key, the better you'll become at understanding picture graphs. Remember, the key is your best friend when decoding a picture graph!
Picture graphs are not just for school; people use them in real life too! Companies use them to show how many products they sell, or how many people like a certain movie. So, learning to read them helps you understand the world around you better!
Keep learning, free
Create a free Syllabax account to unlock practice questions and games for this topic.
Visual Learning Enhanced! 🚀
To help you master this topic, we use Advanced Syllabax AI to generate detailed diagrams and visual models.
Note on Visuals: The AI sometimes makes spelling errors in image labels. Please refer to the lesson text for the correct terminology.