Data About Our Class
Watch this topic in 60 seconds
Free preview · Lesson 1
Understanding Data About Our Class
Learning About Our Class: What is Data?
Hello, amazing fourth graders! Today, we're going on an exciting adventure to become super-sleuths, but instead of finding clues about a mystery, we're going to find clues about... ourselves! That's right, we're going to learn all about our very own class using something called 'data'.
What is 'Data'? It's Like Collecting Information!
Imagine you have a big toy box. Inside, you might have cars, dolls, building blocks, and maybe even a dinosaur! Each of these toys is a piece of information about your toy box. If you counted how many cars you have, how many dolls, or how many red blocks, you're collecting 'data' about your toys!
In our class, 'data' is simply a collection of facts or information. It could be about anything! Like, how many people in our class like pizza, what's everyone's favorite color, or how many siblings each person has. When we ask questions and write down the answers, we are collecting data.
Think of it like this: If your family wants to know what kind of movie everyone wants to watch, they might ask, 'Who wants to watch an action movie? Who wants to watch a comedy? Who wants to watch a cartoon?' The answers they get are data! This data helps them make a choice that hopefully makes most people happy.
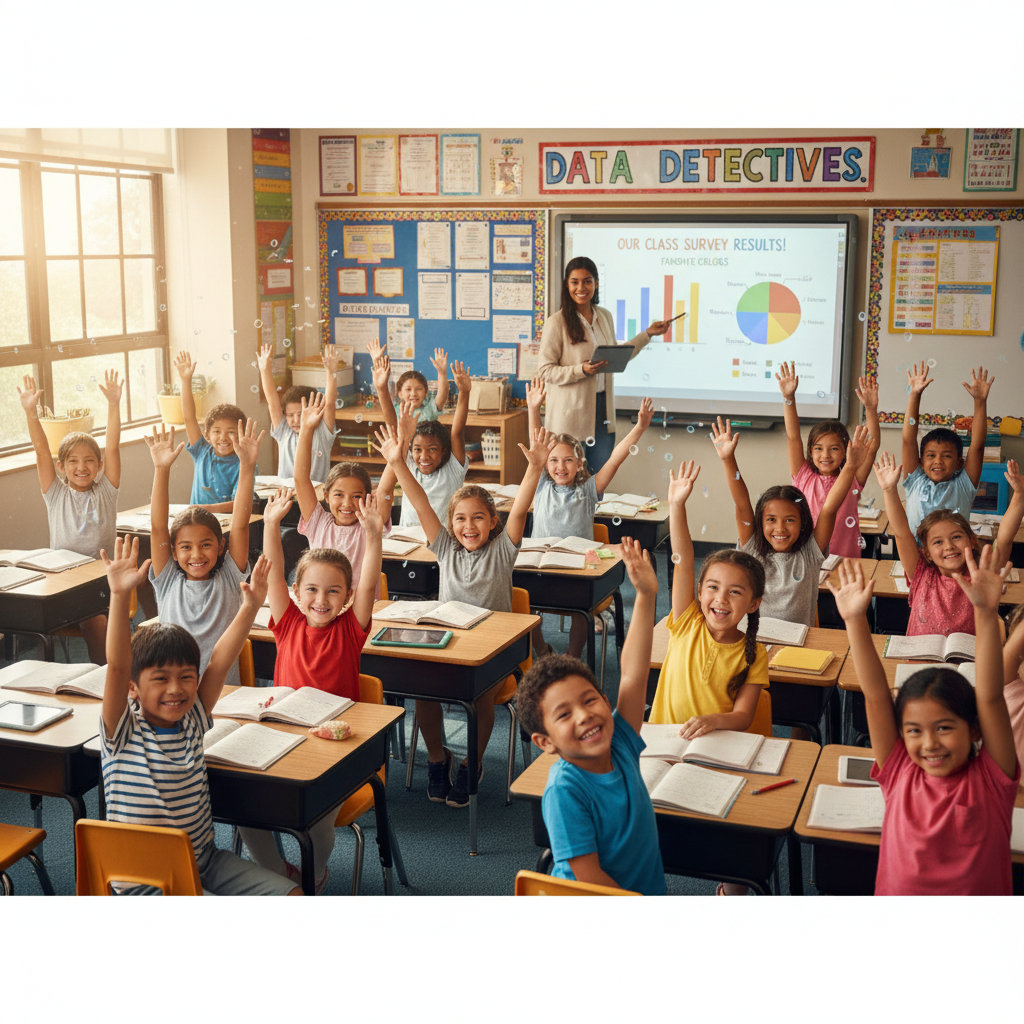
Why Do We Collect Data About Our Class?
Collecting data isn't just for grown-ups or scientists; it's super useful for us too! Here's why:
- To Understand Each Other Better: If we know that most people in our class love reading, we might decide to have more 'reading time' or start a class book club! If we learn that many of us have pets, we could have a 'show and tell' day for our furry friends (or fishy friends!).
- To Make Fair Decisions: Let's say we need to pick a new class pet. Instead of just guessing, we could collect data on what kind of pet everyone would like. If most people want a hamster, that data helps us make a decision that reflects what the class wants.
- To See Patterns: Sometimes, when we look at our data, we notice interesting things. Maybe most of us have birthdays in the spring, or almost everyone walks to school. These are 'patterns' that data helps us discover. It's like finding a secret code in the numbers and answers!
What Kinds of Data Can We Collect About Our Class?
There are so many fun things we can find out! Here are some ideas:
- Favorites: Favorite color, favorite animal, favorite subject, favorite food, favorite season.
- Numbers: How many siblings do you have? How many books did you read last month? How many pets are in your house? What's your shoe size?
- Categories: Do you walk, bike, or ride a bus to school? Are you a morning person or a night owl? What's your favorite type of music?
Each question we ask helps us collect a different piece of data. It's like putting together pieces of a puzzle to see the whole picture of our amazing class!
How Do We Collect Data? (The Fun Part!)
There are a few simple ways to gather our class data:
- Asking Questions: This is the easiest way! Your teacher might ask, "Raise your hand if your favorite color is blue!" and then count the hands. Or you might go around and ask each classmate individually.
- Observing: Sometimes we can just look and see. For example, we could count how many students are wearing sneakers versus boots today. Or how many have packed lunches versus buying lunch.
- Surveys: This is like giving everyone a small paper with a question on it, and they write down their answer. Then, you collect all the papers and read the answers.
Organizing Our Data: Making Sense of It All
Once we collect data, it can look like a big jumble of answers. Imagine you just counted all your toys and wrote down 'car, car, doll, block, car, doll, dinosaur...' It's hard to know what you have a lot of! So, we need to organize it.
One super simple way to organize data is using Tally Marks. Remember how to make tally marks? Every time someone says 'blue' for their favorite color, you make a little line | . When you get to five, you draw a line across the first four: |||| . This makes it easy to count groups of five!
We can also use simple charts. For example, a Picture Graph uses pictures to show how many. If 5 people like apples, you draw 5 apple pictures. A Bar Graph uses bars of different lengths to show how many. If 7 people like bananas, you draw a bar that goes up to the number 7.
What Does Our Data Tell Us?
After we collect and organize our data, we can finally understand what it means! We can ask questions like:
- What is the most popular favorite color in our class? (This is called the 'mode'!)
- How many more students prefer dogs over cats?
- Are there more students who walk to school or ride the bus?
By looking at our organized data, we can answer these questions and learn amazing new things about our unique and wonderful class!
So, get ready to be a data detective! We're going to discover so many cool things about our class, and it all starts with asking questions and collecting information!
Keep learning, free
Create a free Syllabax account to unlock practice questions and games for this topic.
Visual Learning Enhanced! 🚀
To help you master this topic, we use Advanced Syllabax AI to generate detailed diagrams and visual models.
Note on Visuals: The AI sometimes makes spelling errors in image labels. Please refer to the lesson text for the correct terminology.