Our Favorite Things Data
Watch this topic in 60 seconds
Free preview · Lesson 1
Understanding Our Favorite Things Data
Our Favorite Things: Discovering Data!
Hey super learners! Have you ever wondered what your friends like to eat the most, or what their favorite game is? When we find out answers to these kinds of questions, we are actually collecting something super important called data! Data is just a fancy word for information or facts that we gather. Think of it like collecting your favorite stickers or trading cards – each one is a piece of information about something cool!
What is Data? The Building Blocks of Information!
Imagine you want to bake a delicious cake. What do you need? Flour, sugar, eggs, milk, and so on! Each of these ingredients is a small piece of information that helps you make the cake. In the same way, data is like all those little ingredients that help us understand something bigger. It's any kind of fact or information we can collect.
For example, if I ask you, "What is your favorite color?" and you say "Blue," then "Blue" is a piece of data! If I ask your friend and they say "Red," then "Red" is another piece of data. Simple, right?
Collecting Data: Asking Questions and Gathering Facts!
So, how do we get this data? We collect it! The easiest way to collect data about our favorite things is to ask questions. We can ask questions like:
- What is your favorite animal?
- What is your favorite food for lunch?
- What is your favorite season (Spring, Summer, Autumn, Winter)?
- What is your favorite storybook?
When you ask these questions and write down the answers, you are a data collector! You're like a detective, gathering clues to solve a mystery about what people like.
Organizing Data: Making Sense of Our Favorite Things!
Once we collect all this data, it might look like a big jumble of words or numbers. Imagine if you just threw all your toys in a big pile – it would be hard to find what you're looking for! That's why we need to organize our data. Organizing helps us see patterns and understand what the data is telling us.
Tally Marks: Our First Helper for Counting!
One super cool and easy way to organize data is using tally marks. Tally marks are just lines that we draw to count things. Each line stands for one item. When we get to five, we draw a line across the first four. It looks like a little gate or a bundle of sticks!
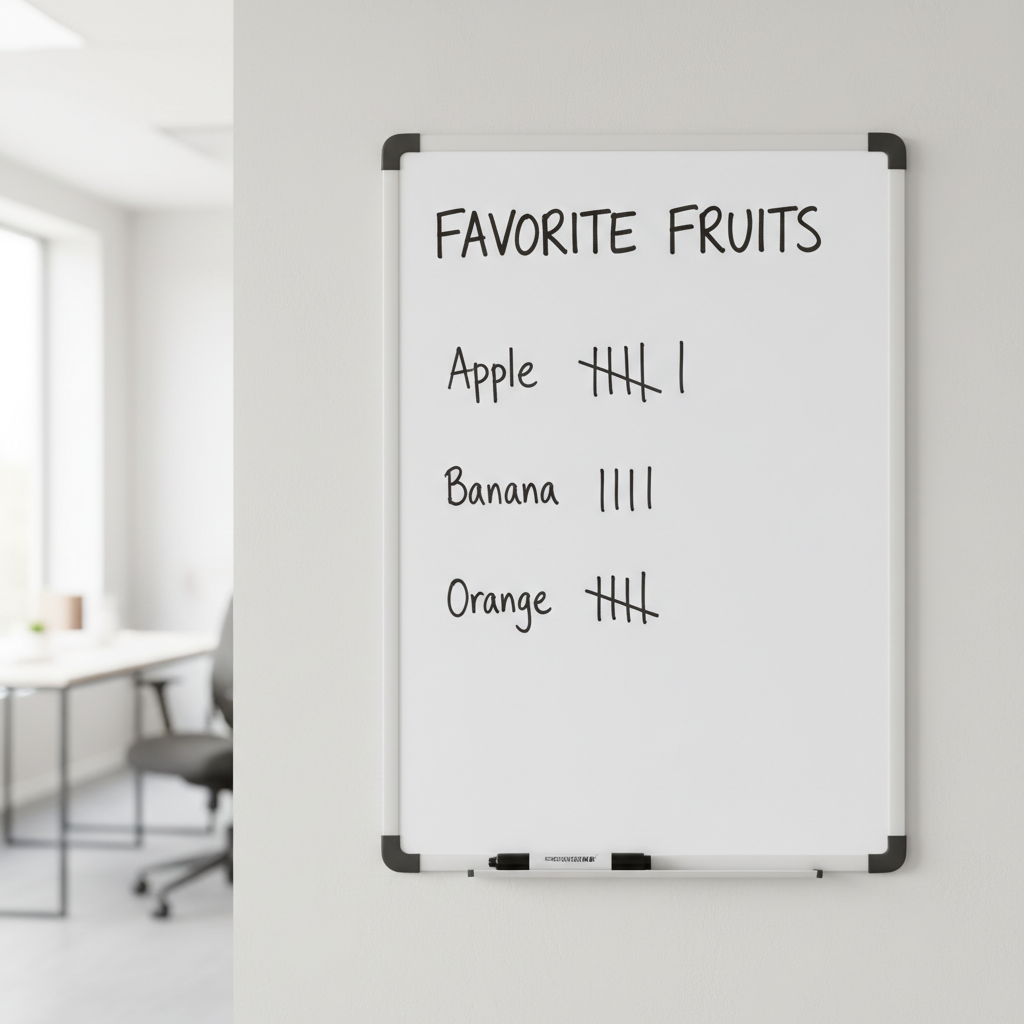
Think about playing a game with your friends and keeping score. Every time someone scores a point, you might draw a line. That's a tally mark! Let's say we asked our classmates about their favorite fruits:
- Apple: |||| | (This means 5 + 1 = 6 people like apples)
- Banana: ||| (This means 3 people like bananas)
- Orange: |||| (This means 4 people like oranges)
See how easy that makes it to count? The "gate" of five makes it much faster to count big numbers.
Picture Graphs (Pictographs): Drawing Our Data!
After tally marks, we can make our data even more fun to look at by using a picture graph, also called a pictograph. In a picture graph, we use little pictures or symbols to represent our data. It's like using emojis to show how you feel – each emoji tells a quick story!
Let's use our favorite animal example. If one little paw print stands for one student, a picture graph might look like this:
- Dogs: 🐾🐾🐾🐾🐾 (5 students)
- Cats: 🐾🐾🐾 (3 students)
- Fish: 🐾🐾 (2 students)
Sometimes, one picture might mean more than one thing. For example, one paw print could mean 2 students! But for now, let's keep it simple: one picture equals one person. This makes it super easy to see which animal is the most popular just by looking at the line of pictures!
Bar Graphs: Building Towers of Data!
Another very common and helpful way to show data is with a bar graph. Imagine you're building towers with colorful blocks. A taller tower means more blocks, right? A bar graph works exactly like that! Each category (like "favorite color" or "favorite sport") gets its own bar, and the longer or taller the bar, the more people chose that option.
Bar graphs usually have two sides. One side lists the categories (like "Red," "Blue," "Green"), and the other side has numbers to show "how many."
Let's say we asked about favorite ice cream flavors:
- Vanilla: A bar that goes up to 8 on the number scale.
- Chocolate: A bar that goes up to 10 on the number scale.
- Strawberry: A bar that goes up to 5 on the number scale.
Just by looking, you can quickly tell that chocolate is the most popular because its bar is the tallest! Bar graphs help us compare things very easily.
Reading Data: What Do the Pictures and Bars Tell Us?
Collecting and organizing data is great, but the most exciting part is reading the data! This means looking at our tallies, picture graphs, or bar graphs and figuring out what they tell us. It's like reading a secret message!
When you look at a graph, you can answer questions like:
- Which item is liked by the most people? (Look for the tallest bar or longest row of pictures!)
- Which item is liked by the least people? (Look for the shortest bar or shortest row of pictures!)
- How many people chose a certain item? (Count the tallies or pictures, or look at the number next to the bar!)
- How many more people chose one item over another? (Find the difference between two counts, like subtracting!)
- How many people were asked in total? (Add up all the counts!)
Reading data helps us understand a lot about our class, our friends, or even things in our community. For example, if the school cafeteria sees that most students like pizza, they might decide to serve pizza more often!
Why Is Data Important?
Understanding data is a superpower! It helps us make decisions, learn about the world around us, and even understand each other better. When we know what our friends like, we can plan fun activities everyone will enjoy. When businesses know what customers like, they can make better products. Data helps us make smart choices every day!
Let's Remember!
Data is information. We collect it by asking questions. We organize it with tally marks, picture graphs, and bar graphs. And then, we read it to find out interesting facts and make good decisions. You are now a data expert!
Keep learning, free
Create a free Syllabax account to unlock practice questions and games for this topic.
Visual Learning Enhanced! 🚀
To help you master this topic, we use Advanced Syllabax AI to generate detailed diagrams and visual models.
Note on Visuals: The AI sometimes makes spelling errors in image labels. Please refer to the lesson text for the correct terminology.